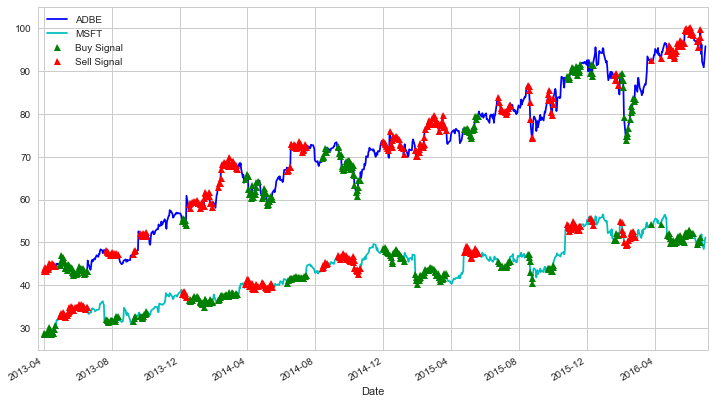
This project involves using a combination of statistics along with financial thoery to demonstrate a popular trading strategy used in equity markets: Pairs Trading.
Our goal involves the following:
- Part 1: Creating a model that test for stationarity.
- Part 2: Creating a model that test for cointegration.
- Part 3: Assigning a portfolio of assests and testing for a cointegrated pair among the dataset.
- Part 4: Establishing features and labels that will allow us to create trading signals for the strategy.
I used the data from Yahoo Finance, which provides historical financial data for free. This data was extracted via the yFinance Python module.
The following are the modules we will use in this notebook. However, the program relies on many more dependencies than what is shown here. Please be sure to set up a virtual enviroment and install the requirements.txt file before running this programming on your own.
- Jupyter NoteBook
- Numpy
- Pandas
- Matplotlib
- Seaborn
- Statsmodels
- Pandas DataReader
- DateTime
- yFinance (formally known as
Fix Yahoo Finance)
