A data visualization application for Android. The created charts are saved using SQLite. The used libraries are:
- MPAndroidChart for chart generation
- Gson for converting Java objects to their JSON representation
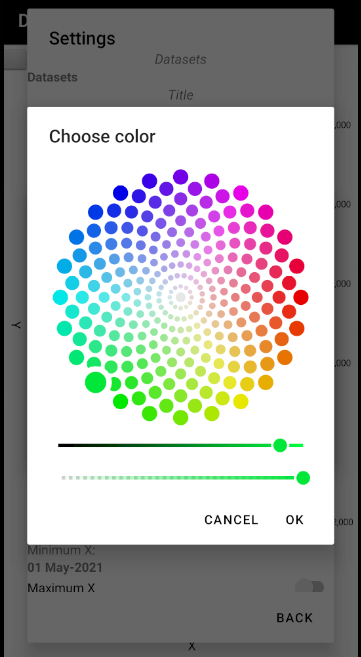
- Color picker for picking colors
- Apache POI for working with xls and xlsx files
- OpenCSV for working with csv files
Features:
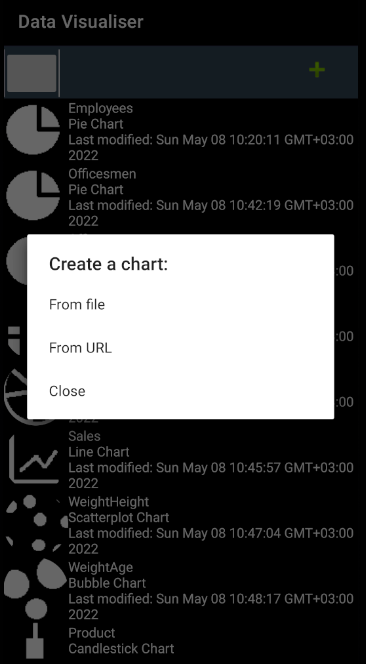
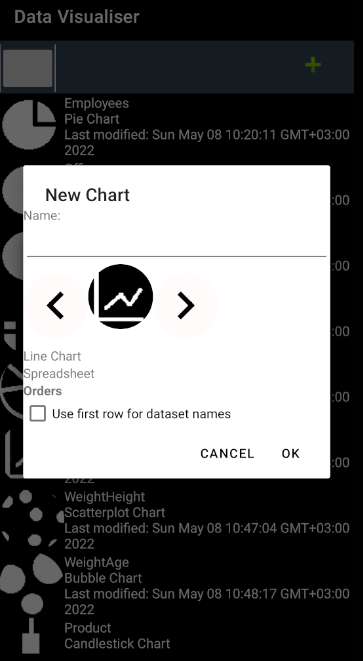
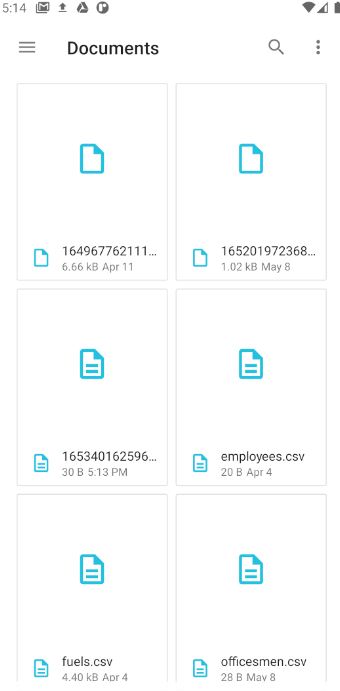
- Chart generation from files. Supported file formats: xls, xlsx, csv, chart files
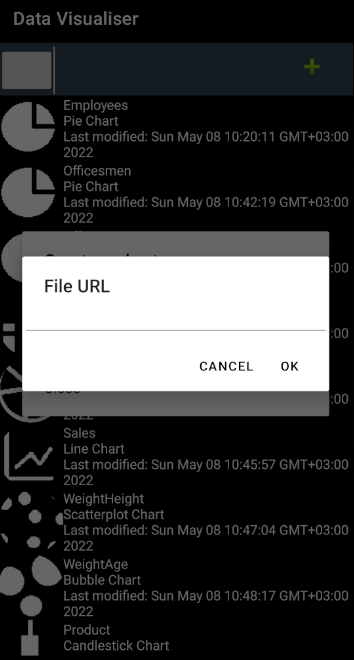
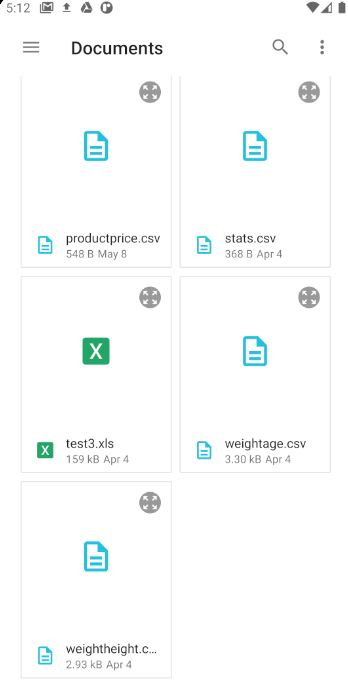
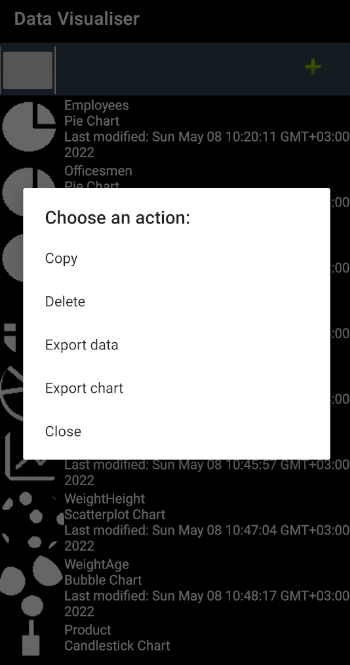
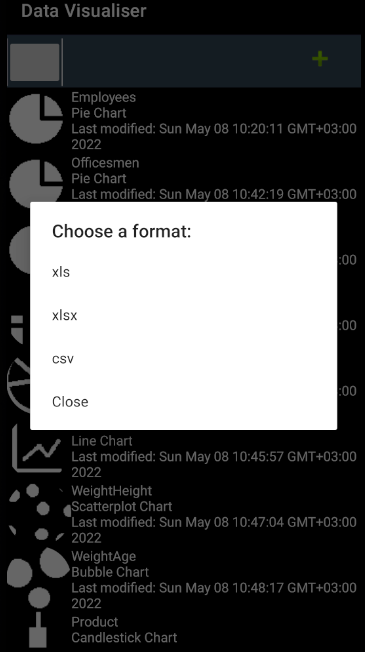
- Charts can be exported or imported. Data can be exported. Supported file formats: xls, xlsx, csv, chart files
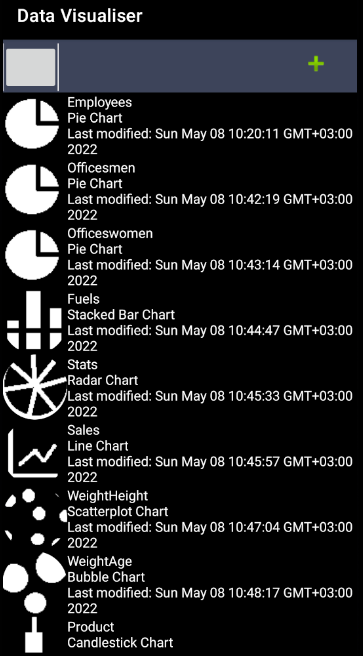
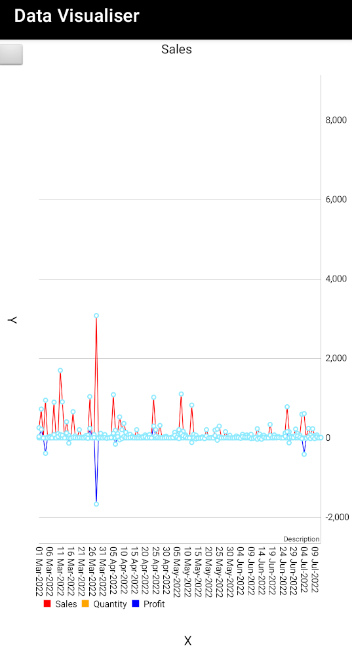
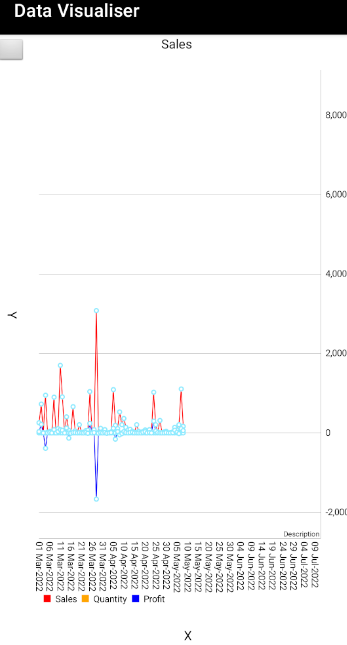
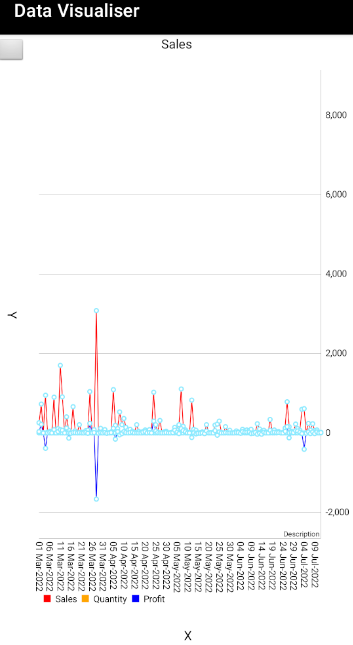
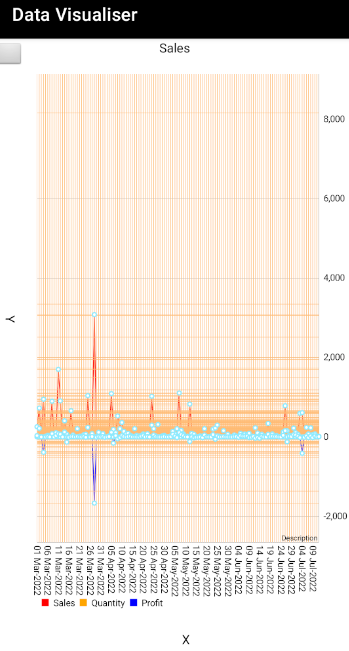
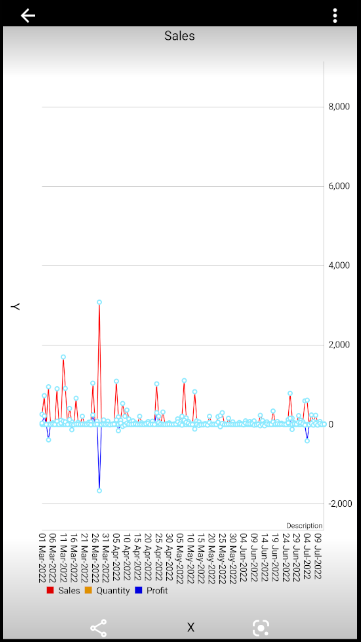
- Chart visualization
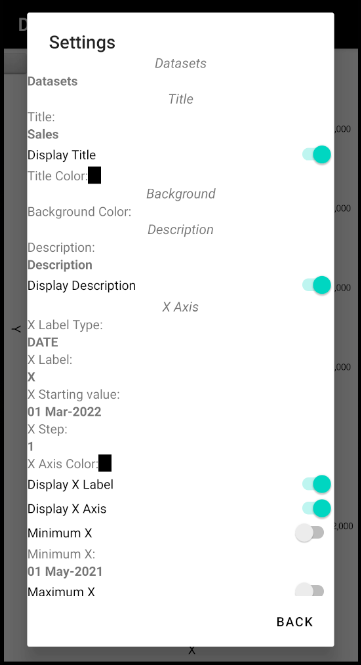
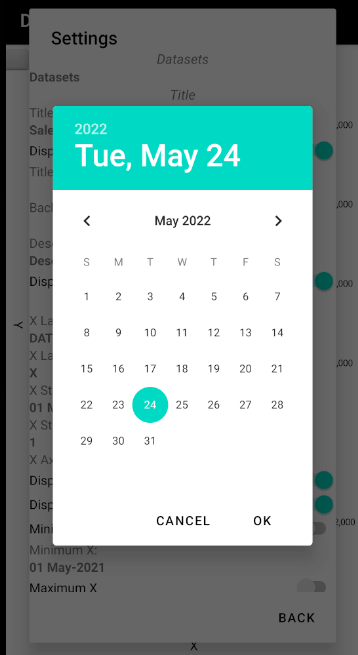
- The charts can be customized
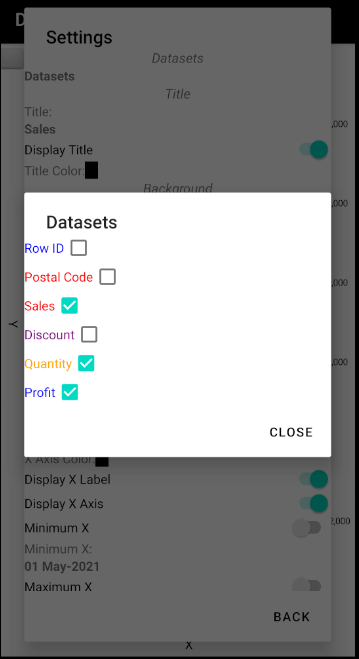
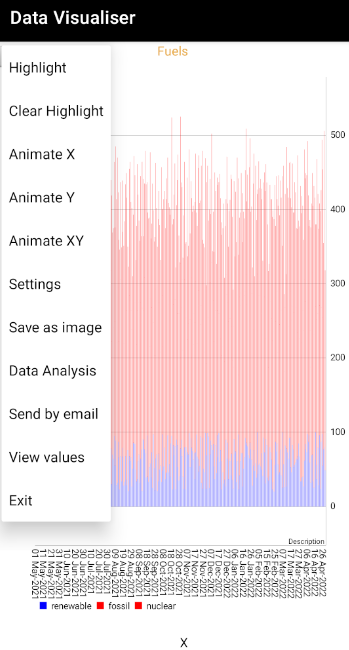
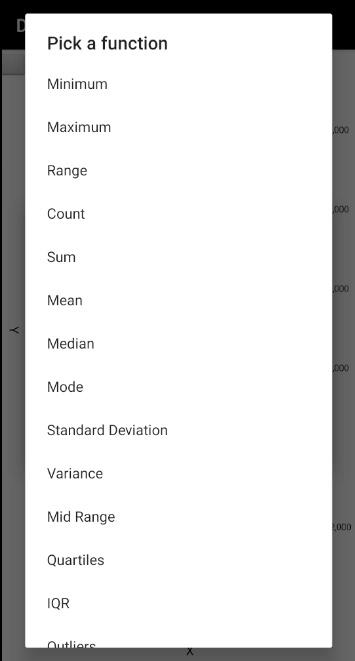
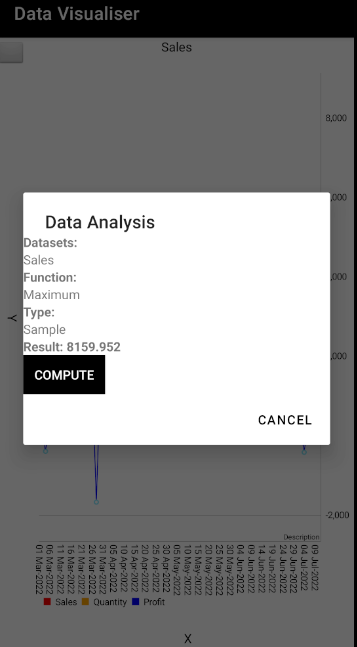
- The data can be analyzed by applying functions to it

- Build up animations on both axes
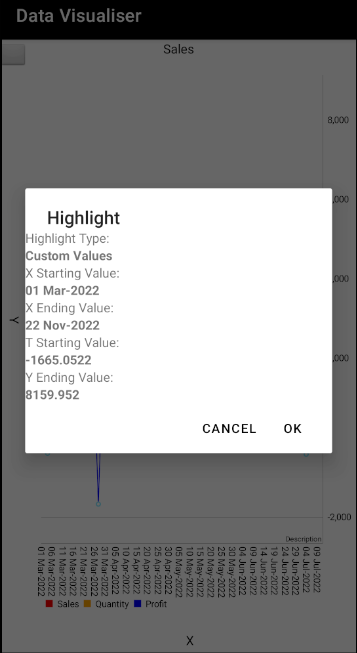
- The data can be highlighted. It can highlight values in a given range or all the increasing or decreasing values
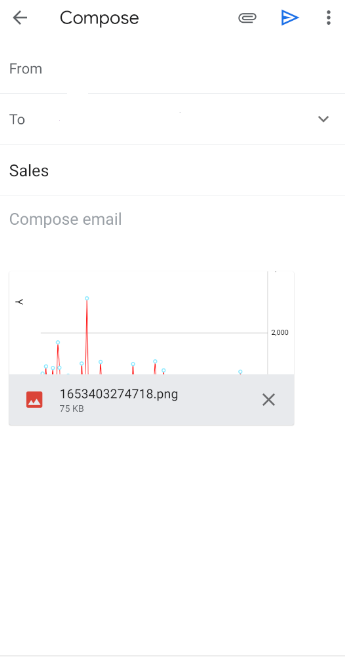
- Export charts as images
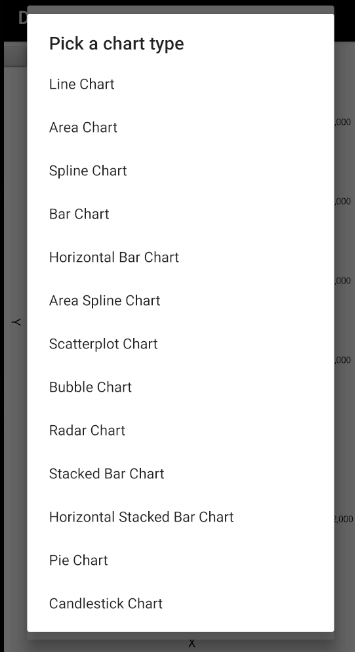
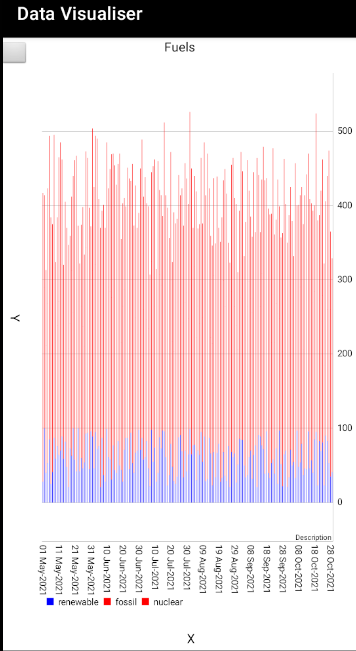
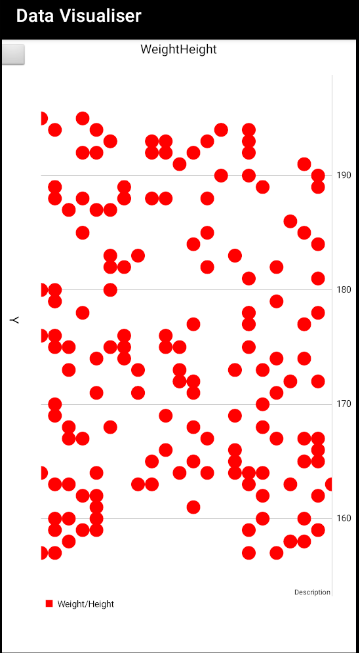
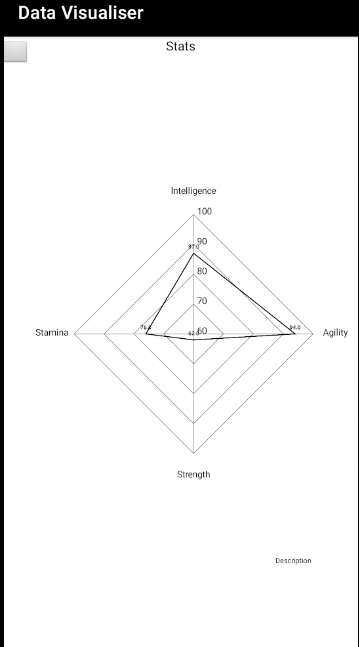
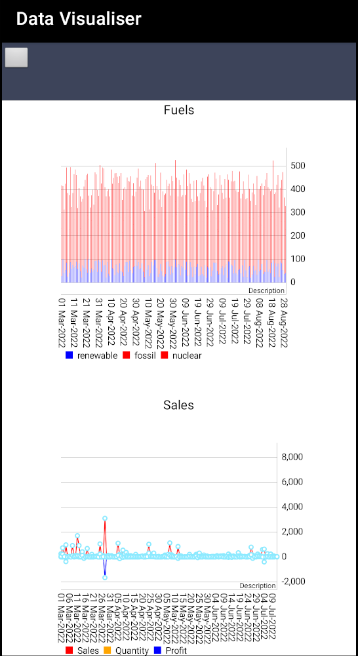
- Multiple chart types: line chart, bar chart, pie chart, bubble chart, scatter plot chart, radar chart, candlestick chart
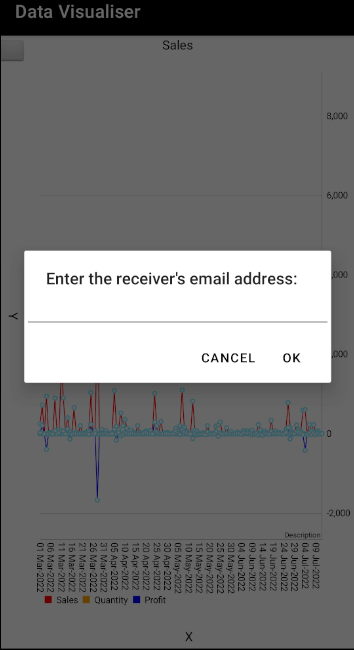
- Send charts by email
- Connect charts, displaying a chart when a value is clicked


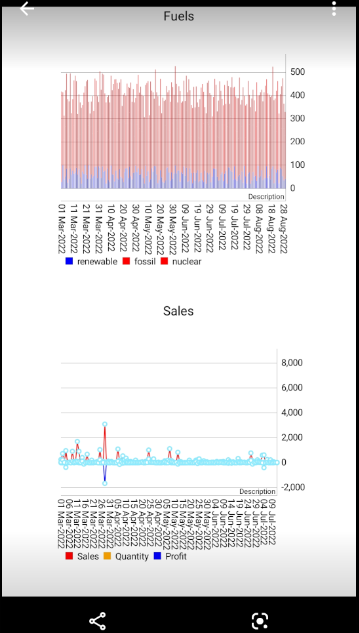
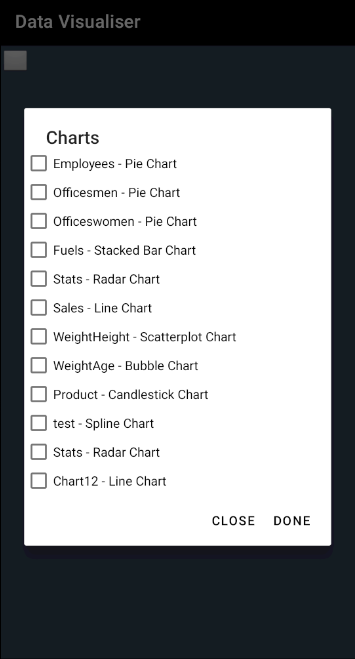
- A dashboard where multiple charts can be displayed
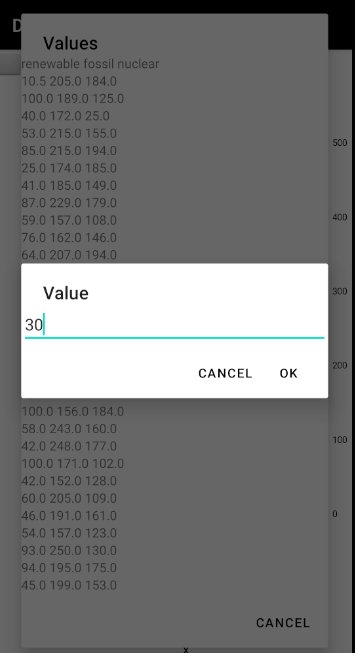
- The data displayed in the charts can be viewed and modified