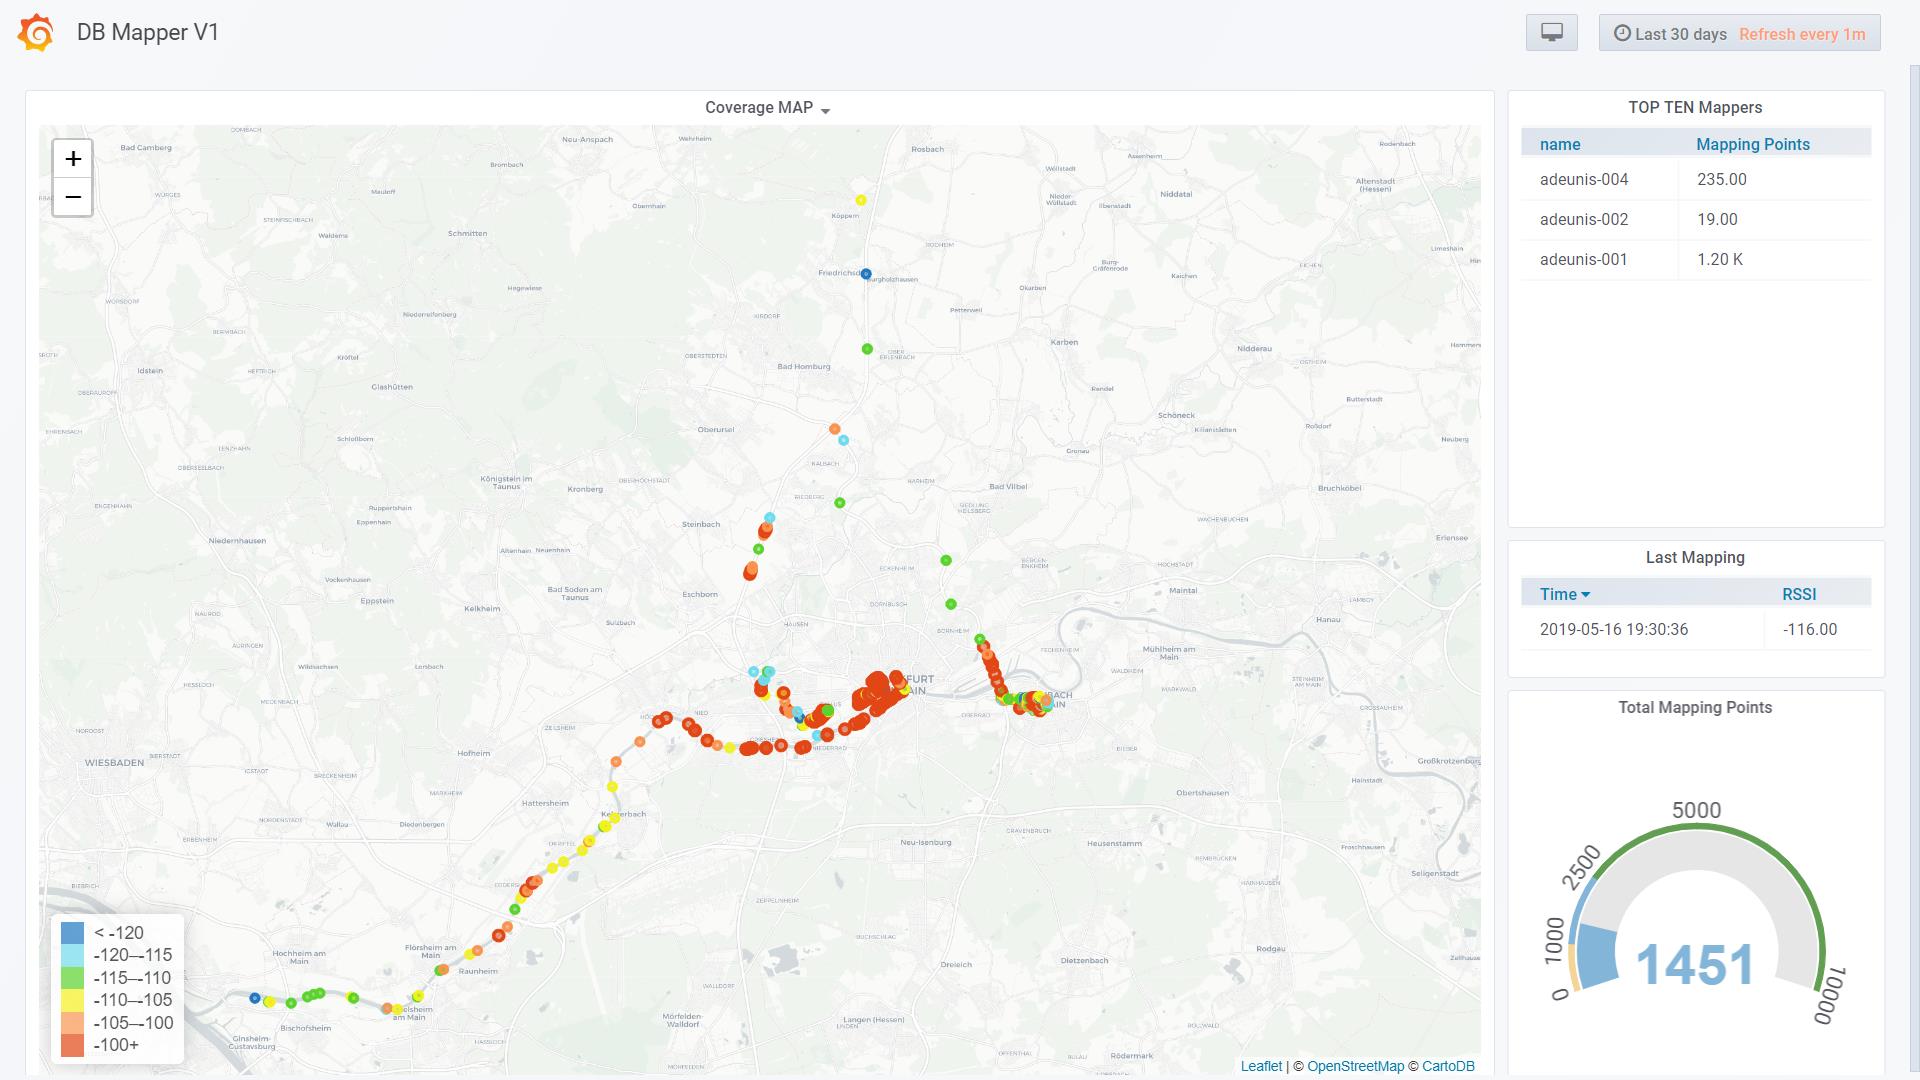
Do you want to develop your own LoRaWAN mapper within 2 hours based on opensource?
This tutorial will guide you through the necessary steps. To be honest this does not even reach the solution from JP Meijers, but if you want to get hands on to use Node-Red, InfluxDB and Grafana for dashboarding this might be interesting for you.
This tutorial will guide you to set up a solution on your local machine (Windows 10 or Raspberry). We did deploy the final solution in the cloud using OpenShift.
What do you need to install:
- Node-Red
- InfluxDB
- Grafana
I will not focus on how to install that. You will find a lot of How-TOs in the internet for that.
https://nodered.org/docs/platforms/windows
https://docs.influxdata.com/influxdb/v1.7/introduction/
https://grafana.com/docs/installation/windows/
Once you have installed that you can start.
Once you have Node-Red up and running ( http://127.0.0.1:1880 ) you have to install some nodes
- node-red-node-geohash
- node-red-contrib-influxdb (should be installed from scratch) The flow in Node -Red looks quite simple.
The MQTT node listens on a topic from the MQTT Broker of TheThingsNetwork (your application on TTN). The JSON Node just brings the result in a pretty JSON format. The Grafana Wordmap panel that we will use later needs a geohash. This is the job of the geohash node. With the input of latitude and longitude it generates a geohash. The next functions parse in the geohash in the payload and the influxdb node writes that into an influxdb database.
Fill in as MQTT Server eu.thethings.network on Port 1883. The username is the name of your TTN application, the password is the access key of your application.
For mapping we use an Adeunis Field Test device. The following payload parsing is based on that device. If you would like to use the Adeunis and do not have payload decoder you will find a tutorial here:
Using a Debug nodes in the flow is very helpful to test the output of every single step before continuing.
This node does not have a specific configuration. Just provides a pretty JSON format.
Now we have to parse the payload of the Adeunis device with the fields we want to store in the database. I decided to keep that node simple to use the RSSI und SNR downlink measurements for the map later.
Here is the code snipped for this function. If you use a different device or a different payload decoder in your application, you have to adjust this:
var thing = {

    name: msg.payload.dev_id,

    lat:msg.payload.payload_fields.latitude,

    lon:msg.payload.payload_fields.longitude,

    application:msg.payload.app_id,

    counter:msg.payload.counter,

    SF:msg.payload.metadata.data_rate,

    RSSI_DL:msg.payload.payload_fields.rssi_dl,

    SNR_DL:msg.payload.payload_fields.snr_dl,

}

msg.payload = thing;

return msg;
This node does not have a specific configuration. Just provides the geohashes.
Now we have to integrate the geohash in die payload. The tricky thing is that the Grafana Worldmap Plug-In needs the geohash and name field as a tag. Thanks a lot to Andreas Motl from the Grafana community for his help on this:
https://community.grafana.com/t/influxdb-and-grafana-plugin-worldmap-panel/16761
This is done in node-red node “Parse In Geohash” formatting the message payload for Geohash and Name as an array before writing into the database.
If msg.payload is an object containing multiple properties, the fields will be written to the measurement. If msg.payload is an array containing two objects, the first object will be written as the set of named fields, the second is the set of named tags.
Here is the code snipped for this function:
var thing = [{

    lat:msg.payload.lat,

    lon:msg.payload.lon,

    application:msg.payload.application,

    counter:msg.payload.counter,

    SF:msg.payload.SF,

    RSSI_DL:msg.payload.RSSI_DL,

    SNR_DL:msg.payload.SNR_DL,

},

{

  geohash:msg.payload.geohash,

  name:msg.payload.name

}

]

msg.payload = thing;
return msg;
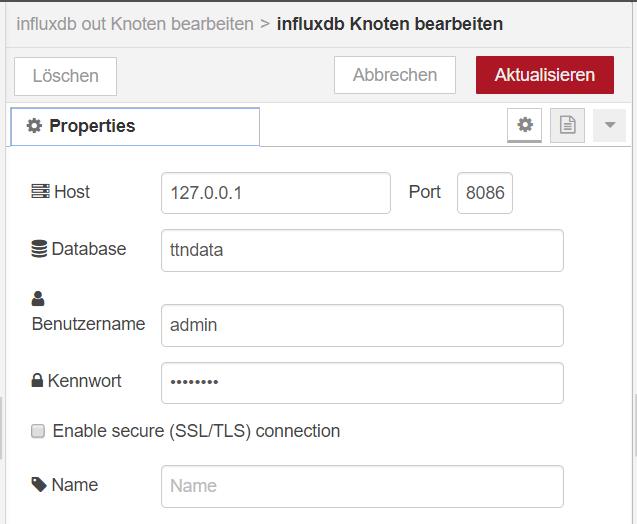
Finally, the data will be written into the InfluxDB database. 127.0.0.1 is your localhost Port 8086 “ttndata” is this example is the name of the influx database (you have to create the database in the next step before you can write to the database) “loradbmapper” is the name of the measurement Username and password are from the influxdb what you have to setup in the next step.
Now you are done with Node-Red. Before the flow can work you have to setup the InfluxDB
Once you have installed influxdb und startet the influx (Influx demon) you have to create a database und a users with rights.
See: https://docs.influxdata.com/influxdb/v1.7/introduction/getting-started/
Open a command shell (CMD).
Goto your InfluxDB directory.
Start Influx Demon ( influxd )
Open a second shell
Run influx
Create a database:
CREATE DATABASE ttndata
Create a user with rights:
CREATE USER admin WITH PASSWORD yourpassword WITH ALL PRIVILEGES
Once you have written first data into your database you can check them with the command line interface.
There you are. Time to get the dashboard up and running.
Start Grafana Server:
Open the Grafana URL:
Under Configuration – Add the InfluxDB as a datasource
Install the Worldmap Panel: https://grafana.com/plugins/grafana-worldmap-panel/installation
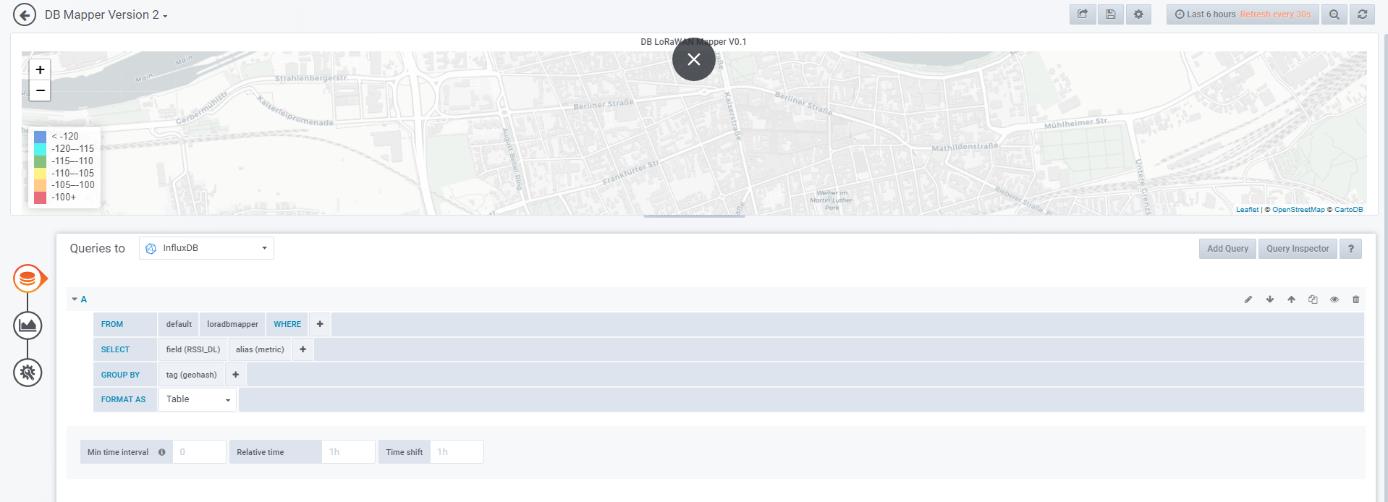
Now you can Create the Dashboard with the following query and configuration:
You can add further panel for you needs:
Example:
Follow us on twitter:
https://twitter.com/IoTSmartBooking
Team sQubic


