International Journal of Environmental Research and Public Health
- Python 3
- Tensorflow
- Matplotlib
- Scikit
- Numpy
The main code is divided in three files (folder notebooks/):
- Holiday - passo 1 - SEIRD Model.ipynb
- Holiday - passo 2 - Data Analysis SEIRD and Mobility.ipynb
- Holiday - passo 3 - Regression.ipynb
Also, all dataset that were used are in dbs/ and dbs/handled/:
- dbs/handled/*
- brasil_df.csv
- cases-brazil-states.csv
- mobility_report_brazil.csv
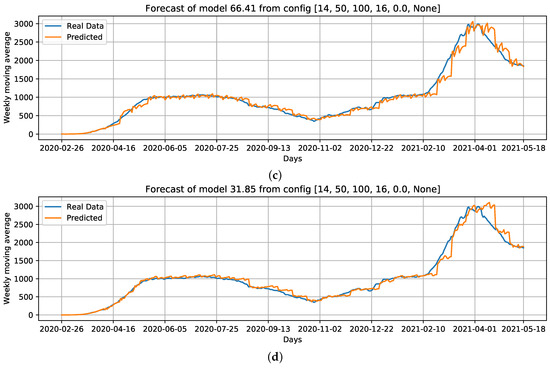
Curves of selected settings: Conf.1: Cases, that is, our baseline case; considering which parameters can improve the baseline case, we select Conf.3: Cases + R0; without using Cases as an input feature, we select Conf.9: R0 + Re + Holiday flag, and; Conf.10: PC1 + PC2 as input data.
(a) COVID-19 daily deaths forecast using cases as input data.
(b) COVID-19 daily deaths forecasts using Cases + R0 as input data.
(c) COVID-19 daily deaths forecasts using R0 + Re + Holiday flag as input data.
(d) COVID-19 daily deaths forecasts using PC1 + PC2 as input data.
For these configurations, we draw the best curves (with the lowest RMSE) of each configuration over the test data.
This work had many contributions and many authors.
If you are interested in using this code in your research, we would like to receive a quote from the original paper:
@Article{ijerph182111595,
      AUTHOR = {Aragão, Dunfrey Pires and dos Santos, Davi Henrique and Mondini, Adriano and Gonçalves, Luiz Marcos Garcia},
      TITLE = {National Holidays and Social Mobility Behaviors: Alternatives for Forecasting COVID-19 Deaths in Brazil},
      JOURNAL = {International Journal of Environmental Research and Public Health},
      VOLUME = {18},
      YEAR = {2021},
      NUMBER = {21},
      ARTICLE-NUMBER = {11595},
      URL = {https://www.mdpi.com/1660-4601/18/21/11595},
      PubMedID = {34770108},
      ISSN = {1660-4601},
      ABSTRACT = {In this paper, we investigate the influence of holidays and community mobility on the transmission rate and death count of COVID-19 in Brazil. We identify national holidays and hallmark holidays to assess their effect on disease reports of confirmed cases and deaths. First, we use a one-variate model with the number of infected people as input data to forecast the number of deaths. This simple model is compared with a more robust deep learning multi-variate model that uses mobility and transmission rates (R0, Re) from a SEIRD model as input data. A principal components model of community mobility, generated by the principal component analysis (PCA) method, is added to improve the input features for the multi-variate model. The deep learning model architecture is an LSTM stacked layer combined with a dense layer to regress daily deaths caused by COVID-19. The multi-variate model incremented with engineered input features can enhance the forecast performance by up to 18.99% compared to the standard one-variate data-driven model.},
      DOI = {10.3390/ijerph182111595}
      }
- CAPES Edital 12/2020 - Telemedicinas e Análise de Dados Médicos

