prediction interval and error analysis #400
Comments
|
You can use R or other statistical softwares with plotting function. |
|
Dear Zheng:
Thank you so much. Can you speak chinese? I am a student of Huazhong agricultural university, Wuhan, Hubei. I am a newer in PBPK modeling. I need your help, this is my QQ number: 272652338. Thank you for your help.
…------------------ 原始邮件 ------------------
发件人: "Liang Zheng"<notifications@github.com>;
发送时间: 2019年10月18日(星期五) 上午10:22
收件人: "Open-Systems-Pharmacology/Forum"<Forum@noreply.github.com>;
抄送: "周凯翔"<272652338@qq.com>; "Author"<author@noreply.github.com>;
主题: Re: [Open-Systems-Pharmacology/Forum] prediction interval and erroranalysis (#400)
You can use R or other statistical softwares with plotting function.
—
You are receiving this because you authored the thread.
Reply to this email directly, view it on GitHub, or unsubscribe.
|
|
@KaixiangZhou you might also take a look at the new qualification framework provided as an AddOn to the OSP Suite (s. here for details and download instructions). This framework allows creation of qualification reports (also across projects) with variety of plots (e.g. predicted vs. observed). You need to write a so called "qualification plan" (s. here for details) where you can define what kind of plots, tables and qualification measures you would like to see in your report. Qualification Plan (click to expand)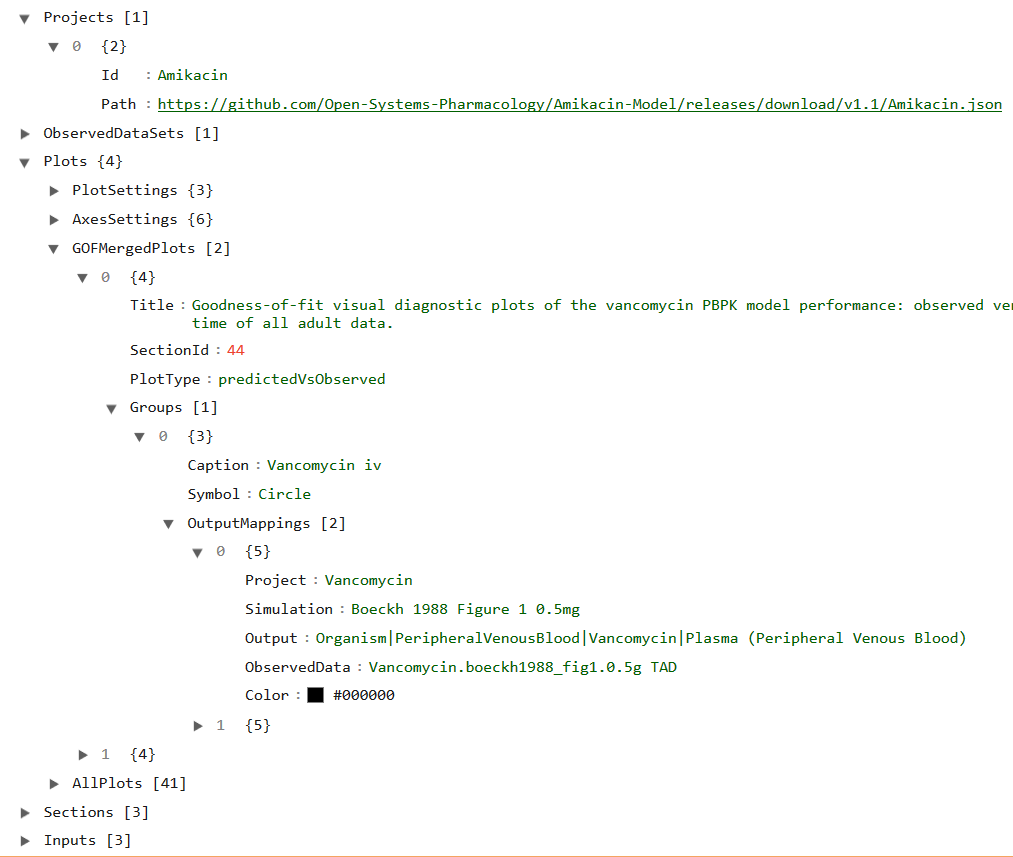
Here you can see some examples of qualification plans and corresponding reports: Best starting point is: take the template from https://github.com/Open-Systems-Pharmacology/Evaluation-plan-template and adjust it to your needs |
|
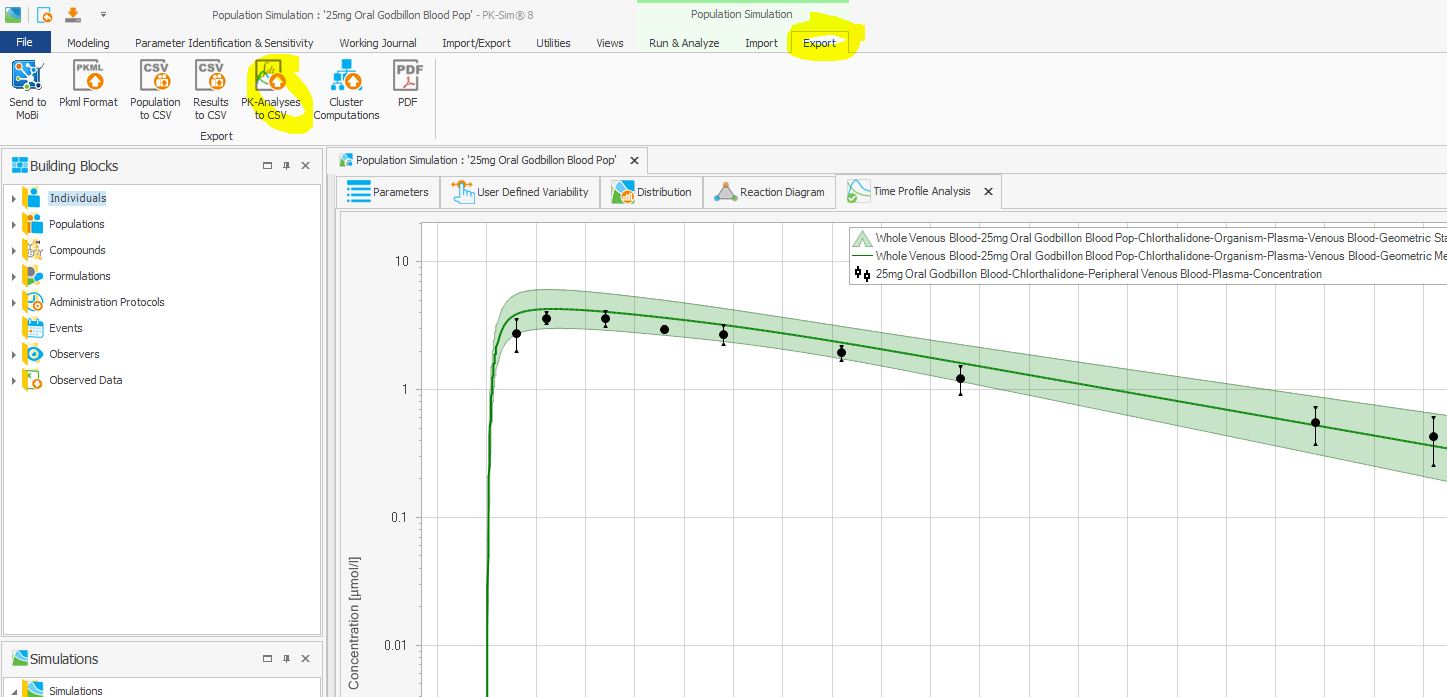
There is a manual way to export the observed and simulated AUC, CL, Vd etc. from your simulations so that you can make the plots above. Individual Simulations: Click 'Show PK Analysis' and Click 'Export to Excel' Population Simulations: Click 'Export' in the top toolbar when your population simulation is open, then click 'PK-analyses-to-CSV' |

|
@KaixiangZhou Closing. Please reopen if there still any questions. |
Dr. Zhou
The text was updated successfully, but these errors were encountered: