Dex.js is a javascript framework for visual components. Dex.js is a child project of Dex for the purpose of achieving visuals which were easily embedded in other javascript and non-javascript projects.
Dex.js takes many of the best open source visual frameworks and wraps them in a consistent interface while also extending their capabilities and creating a way for them to communicate and interoperate with one another.
Additionally, dex.js offers powerful filters for sifting through the noise and gui controls for controling the finer details of how the data is presented.


The best tutorials are probably the included examples. However, here we will touch on some of the high points of dex.js.
All dex components operate upon a csv object. The csv object can be created a variety of ways. Here are a few:
// From JSON
var json = {
  'header' : [ 'Name', 'Gender', 'Age' ],
  'data'   : [[ 'Miles', 'M', 40 ],[ 'Jane', 'F', 34 ]]};
var csv = new dex.csv(json);var csv = new dex.csv(['Name', 'Gender', 'Age'],
[['Miles', 'M', 40],['Jane','F',34]]);var csv = new dex.csv(['Name', 'Gender', 'Age']);
csv.data.push(['Miles', 'M', 40]);
csv.data.push(['Jane','F',32]);var csv = new dex.csv();
csv.header = ['Name', 'Gender', 'Age'];
csv.data.push(['Miles', 'M', 40]);
csv.data.push(['Jane','F',32]);Due to the asynchronous nature of JavaScript, dex.js leverages bluebird promises in order to provide versatile ways for loading data.
var dataPromise = dex.io.readCsv('/dexjs/data/io/presidents.csv')
  .then(function(csv) { renderChart(csv)});

function renderChart(csv) {
  var chart = new dex.charts.d3.ParallelCoordinates({
    parent: "#Chart",
    csv: csv.include(["Party", "Home State", "President", "Presidency"])
  }).render();
}var dataPromise = dex.io.readTsv('/dexjs/data/io/presidents.tsv')
.then(function(csv) { renderChart(csv)});
function renderChart(csv) {
var chart = new dex.charts.d3.ParallelCoordinates({
parent: "#Chart",
csv: csv.include(["Party", "Home State", "President", "Presidency"])
}).render();
}Reading from an xml file is a bit different. Each column must be expressed as it's own xpath expression. This allows us a great deal of flexibility.
We can read an xml of the form:
<csv>
  <row><firstName>joe</firstName><age>22</age></row>
  <row><firstName>jim</firstName><age>33</age></row>
  <row><firstName>sue</firstName><age>44</age></row>
</csv>
via:
var dataPromise = dex.io.readXml('/dexjs/data/io/people.xml')
  .then(function (csv) {
    renderChart(csv)
  });
Given an xml files in alternate forms, we can supply an apprpriate transform:
<?xml version="1.0" encoding="utf-8"?>
<data>
    <letter id="A"><frequency>.08167</frequency></letter>
    <letter id="B"><frequency>.01492</frequency></letter>
    ...
    <letter id="Y"><frequency>.01974</frequency></letter>
    <letter id="Z"><frequency>.00074</frequency></letter>
</data>
The following will create a csv with columns 'letter' and 'frequency':
  var xpaths = {
    letter: "//letter/@id",
    frequency: "//frequency"
  };

  var dataPromise = dex.io.readXml('/dexjs/data/io/letterFrequency.xml',
    dex.io.transform.xml.xpath({letter:"//letter/@id",frequency:"//frequency"})
    .then(function (csv) {
      renderChart(csv)
});Most often, we will want to read in data from JSON files and RESTful services. By default, we accept json files which are arrays of shallow name value pairs such as:
[
  { name: "jack", age: 100 },
  { name: "jill", age: 99 }
]
Here we call a RESTful service which already returns data in the expected name/value pair form:
  var dataPromise = dex.io.readJson('https://jsonplaceholder.typicode.com/todos')
    .then(function (csv) {
      renderChart(csv)
    });

  function renderChart(csv) {
    dex.charts.d3.ParallelCoordinates({
      parent: "#Chart",
      csv: csv
    }).render();
  }
Here is a slightly more complex example where we must supply a custom transformation in order to map the json into the form we require:
  function transform(json) {
    var transformed = [];
    for (key in json.bpi)
    {
      var row = json.bpi[key];
      row.currency = key;
      transformed.push(row);
    }
    return new dex.csv(transformed);
  }

  var dataPromise = dex.io.readJson(
    'https://api.coindesk.com/v1/bpi/currentprice.json', transform)
    .then(function (csv) {
      renderChart(csv)
    });

  function renderChart(csv) {
    dex.charts.d3.ParallelCoordinates({
      parent: "#Chart",
      csv: csv
    }).render();
}Now lets talk about data visualization. We first start off by supplying a target div container for our chart.
<div id='Chart'></div>From there, we can visualize the data in a number of interesting ways such as parallel coordinates:
var chart = new dex.charts.d3.ParallelCoordinates({
  parent: '#Chart',
  csv: csv});
or via a tree (aka dendrogram):
var chart = new dex.charts.d3.Dendrogram({
  parent: '#Chart',
  csv: csv});
or a scatterplot:
var chart = new dex.charts.c3.Scatterplot({
  parent: '#Chart',
  csv: csv});
By now I hope you've noticed that the interfaces between different visuals is quite consistent.
The configuration pane is a special component which provides to main sections:
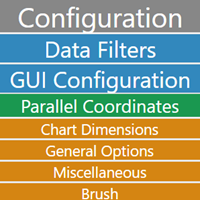
- A data pane for ordering and filtering the data
- A GUI pane for controlling the presentation of the visual.
dex.js offers the capability for dividing a dataset into frames via a sequence value and combining any of the other charts via chart interaction in order to turn the data into an interactive movie of sorts.
Charts can listen and react to each other. They do so via a publish subscribe model. In dex.js, components communicate interesting changes via a publish operation. For example, a data-filter component may communicate that the user has filtered out all data outside of a certain range. Other charts and components may in turn listen for these types of changes via subscribing and receiving and reacting to these changes in realtime.
Let's assume that we have a US map component that allows the user to select individual states and a grid component which wants to do something with that information.
  var pcChart = new dex.charts.d3.ParallelCoordinates({
      'parent': "#ParallelCoordinates",
      'margin': {'top': 40, 'bottom': 30, 'left': 50, 'right': 50},
      'csv': csv
    }
  );

  // Configure a chart.
  var chord = dex.charts.d3.Chord({
      'parent': '#Chord',
      'margin': {'top': 10, 'bottom': 20, 'left': 10, 'right': 10},
      'csv': csv
    }
  );

  chord.subscribe(pcChart, "select", function (msg) {
    // Set the csv data of the chord diagram to the contents of
    // the selected data from the Parallel Coordinates diagram.
    chord.attr('csv', msg.selected).update();
  });

  pcChart.render();
  chord.render();