Repository navigation
Getting started
#Polychart.js Tutorial
Polychart.js is a flexible library for plotting interactive charts. This tutorial will go through the basics of how to create a chart, and how to tweak it to your liking. We'll do this by examples: each example contains a plot, the code, and an explanation of what the code does.
##A Simple Bar Chart
Let's start with creating a simple bar chart.
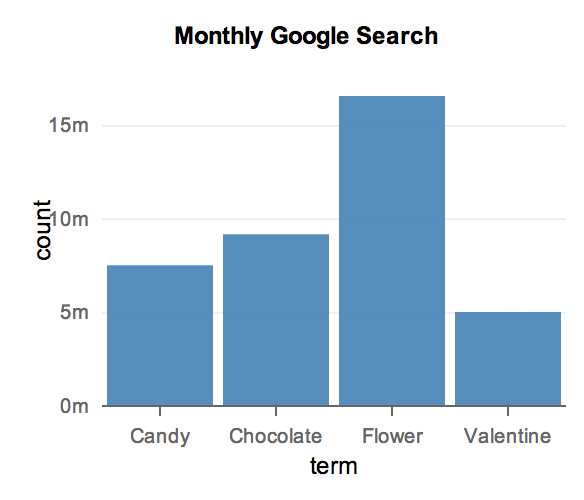
var searchterms = polyjs.data({
    term: ["Flower", "Chocolate", "Candy", "Valentine"],
    count: [16600000, 9140000, 7480000, 5000000]
});
polyjs.chart({
    layer: {
        data: searchterms,
        type: "bar",
        x: "term",
        y: "count"
    },
    title: "Monthly Google Search",
    dom: "chart",
    width: 300,
    height: 250
});
The first function call is to the polyjs.chart() function, which
creates a wrapper on a dataset. This function takes a dataset in
JSON or other formats, and turns it into a data object that
Polychart.js can recognize.
The second function call actually creates the chart.
The polyjs.chart() function takes a specification
and uses it to determine how to render the appropriate chart.
A layer contains information about what is to be plotted. We pass in the
data set object created earlier, and also tells Polychart.js that we would like
to plot a bar chart, with the variable term mapped to the x-axis and
the variable count mapped to the y-axis.
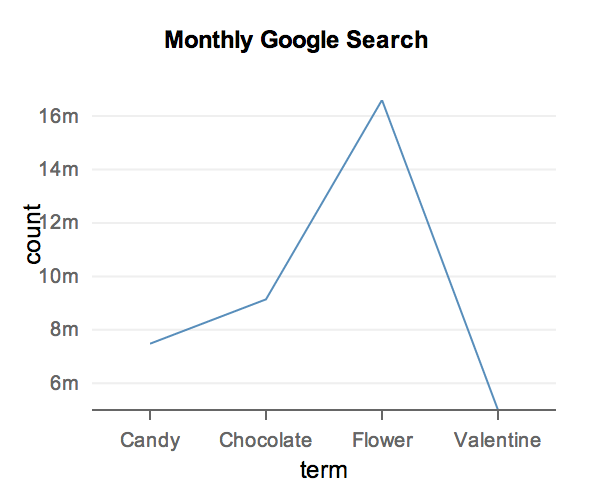
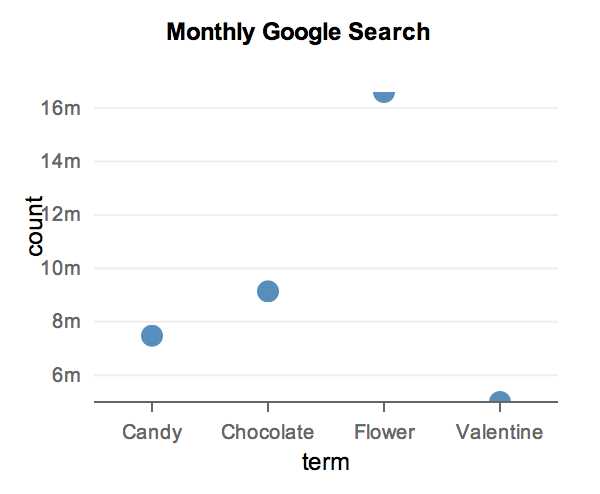
If we had changed the chart type to a line or a point, we would get
one of the below charts:
If you want to create a simple chart, then that is all there is!
##Aesthetic Mappings and Guides
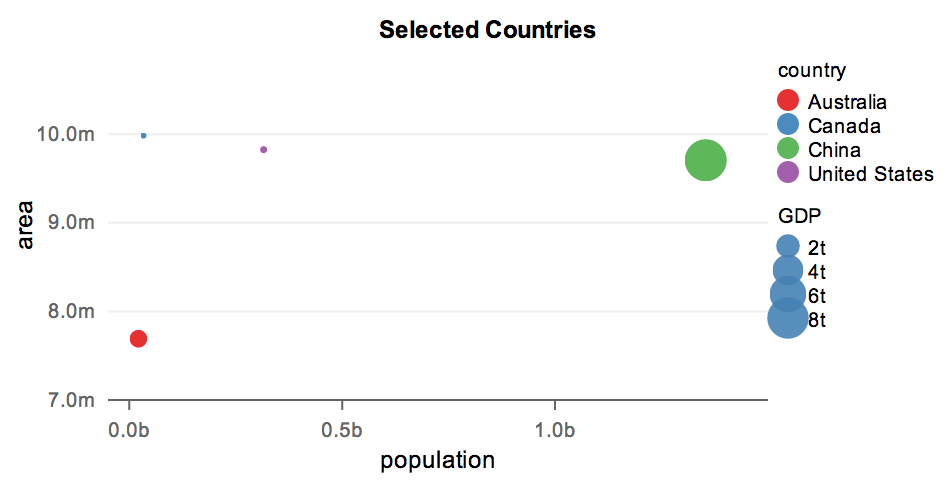
One different between Polychart and most charting libraries is how easy it is to map data directly to some feature of items in a chart, like color, size, or opacity. We bind data to these features called aesthetics much like we do to the x and y-axes:
var countries = polyjs.data([
    { country: "Canada", population: 33476688, area: 9984670, GDP: 1770000000 },
    { country: "United States", population: 315591000, area: 9826675, GDP: 15609700000},
    { country: "Australia", population: 21507717 , area: 7692024, GDP: 915098000000},
    { country: "China", population: 1353821000, area: 9706961, GDP: 8250000000000}
]);
polyjs.chart({
    layer: {
        data: countries,
        type: "point",
        x: "population",
        y: "area",
        color: "country",
        size: "GDP"
    },
    guide: {
        x: { min: -50000000, max: 1500000000 },
        y: { min: 7000000, max: 10500000 }
    },
    title: "Selected Countries",
    dom: "chart",
    width: 500,
    height: 250
});
Notice that in the layer definition, we mapped the aesthetic color to the
data column country, and the aestehtic size to the data column GDP.
Legends were generated automatically by Polychart.js.
Notice also the specification of guides. Whereas layers contain information about what is to be plotted, guides specify how that information should look like on the screen. In this example we specified the minimum and maximum value of the x- and y-axes. We can also use it to specify ticks on the axes, axes titles, the scales or actual method in which data is mapped to the aesthetics, and other options. We will see more examples of guide specifications shortly.
##Multiple Layers, Statistics & Aggregation
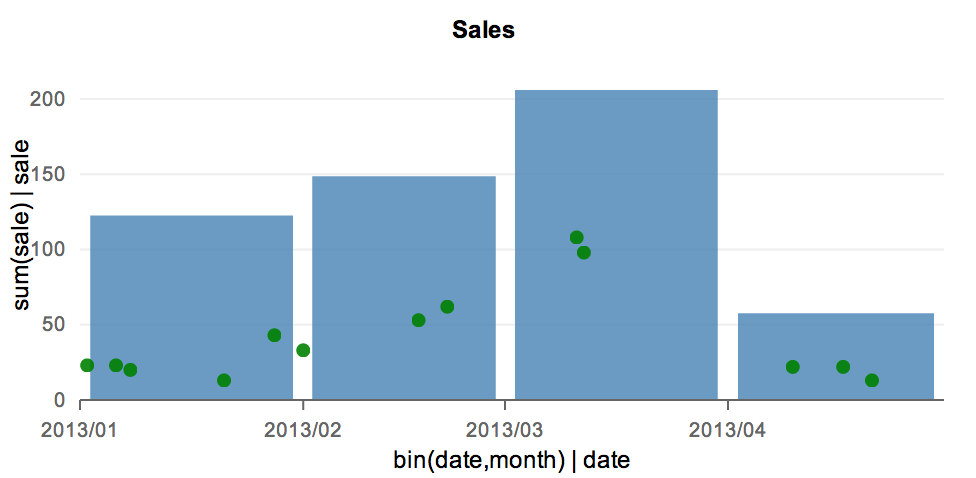
With Polychart, multiple layers can be rendered, one on top of another. Here is an example:
var sales = polyjs.data({
    date: ["2013-01-02", "2013-01-06", "2013-01-08", "2013-01-21", "2013-01-28",
           "2013-02-01", "2013-02-17", "2013-02-21", "2013-03-11", "2013-03-12",
           "2013-04-10", "2013-04-17", "2013-04-21"],
    sale: [23, 23, 20, 13, 43, 33, 53, 62, 108, 98, 22, 22, 13]
});
polyjs.chart({
    layers: [
        {
            data: sales,
            type: "bar",
            x: "bin(date, month)",
            y: "sum(sale)",
            color: { const: "steelblue"},
            opacity: { const: 0.8}
        } , {
            data: sales,
            type: "point",
            x: "date",
            y: "sale",
            color: { const: "green"},
            size: { const: 3 }
        }
    ],
    title: "Sales",
    dom: "chart",
    width: 500,
    height: 250
});
There are several new concepts here. Notice first that instead of specifying a single
layer, we specified an array layers, where each item specifies one layer. Each layer
has its own data set (which could be different, even though in this example it is the
same), its own type, and its own mappings.
This gives you, the developer, a lot of flexibility in terms of the types of visualizations that can be made. But with great power comes great responsibility. You must ensure that different layers map the same type of data to each aesthetic. That is, x-axis mapping of all layers must have the same type (numeric, string/categorical, or datetime), and similarily for y-axis mapping, colour, size, etc.
Another new concept is the idea of aggregation. Notice in the bar chart that we are displaying the sum of sales for each month. This aggregation is done by the Polychart.js library. Notice also that we are binning the x-axis by month, so that Polychart.js knows how wide each bar of the bar chart should be. For more information on how data aggregation and transformation works, read Data Transforms and Statistics here.
A third concept is that of assigning constants to aesthetics. For example here, we are
fixing the colour of the bars to "steelblue". (Notice that if we simply wrote
color: "steelblue", Polychart.js will interpret this as mapping the aesthetic
to a data column called steelblue).