IR Spectrum Tool
The IR Spectrum Tool can be used to produce a Boltzmann-weighted spectrum based on vibrational data. This includes standard IR spectra, as well as Raman and vibrational circular dichroism spectra.
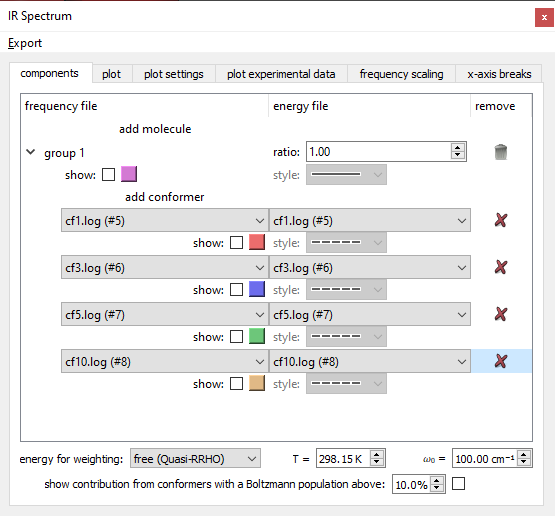
On the first tab (components), you choose what molecules and conformers comprise the sample you are simulating. The ratio of different molecules is determined using the "ratio" option. Conformers in a molecule group are Boltzmann-weighted using the energy specified at the bottom of the tab (free, enthalpy, etc.).
The second tab (plot) shows the spectrum, and also allows you to choose which type of spectrum to look at (IR, Raman, or VCD - availability depends on what is parsed from the files).
Settings to change the appearance of the simulated spectrum are on the third tab (plot settings). This lets you choose the peak broadening and width, whether the x-axis is reversed, and whether to show the spectra for harmonic vibrational data even if anharmonic data was parsed.
Data from a CSV file can be added to the plot from the "plot experimental data" tab.
Frequency scale factors can be applied on the "frequency scaling" tab. Here, you can also lookup scale factors from databases by method and basis set. See the scale factor database for recommendations on how to cite the scaling factors you use from them.
The last tab allows you to plot specific sections of the x-axis. You can add any number of sections, defined by a minimum and maximum wavenumbers.