Analyzing student work is an essential part of teaching. Teachers assign, collect and examine student work all the time to assess student learning and to revise and improve teaching.Student assessment enables instructors to measure the effectiveness of their teaching by linking student performance to specific learning objectives. As a result, teachers are able to institutionalize effective teaching choices and revise ineffective ones in their pedagogy.Performance Analysis (PA) is a gathering data methodology that represents an objective observation system that provides useful information to improve performance.Ongoing assessment of student learning allows teachers to engage in continuous quality improvement of their courses. Many factors can influence a student's performance, including the influence of the parents' educational background, test preparation, student health, and so on.


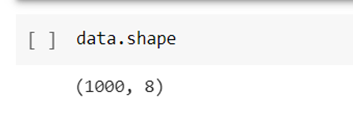
The dataset has 1000 rows and 8 columns.

There are no missing values in the dataset.


There 5 categorical columns and 3 numerical columns The dataset has no null or duplicate values
Attribute Information
Categorical columns are:
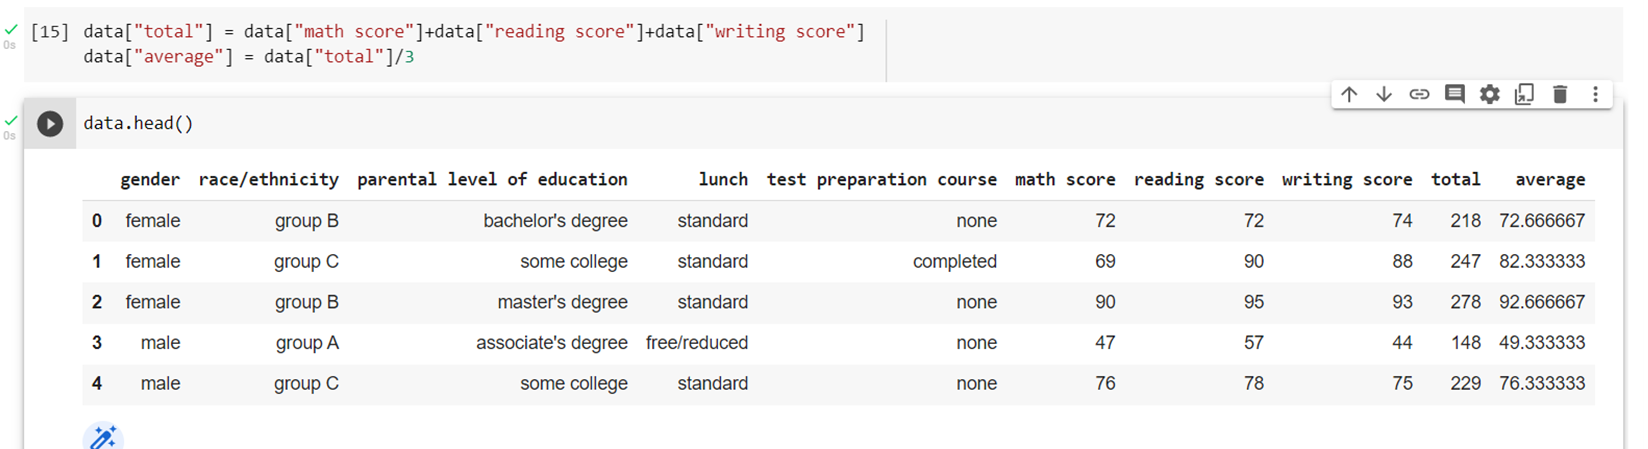
Gender: Male or Female Race/ethnicity: 5 groups, from group A to group E Parental level of education: from high school to a master’s degree lunch: free/reduced or standard. Numerical columns are:
Math score: out of 100 Reading score: out of 100 Writing score: out of 100 The dataset contains the data of about 1000 students. This analysis aims to understand the influence of important factors such as parental level of education, the status of test preparation course etc. on the performance of the students in the exams.


Out of the total number of students, 51.89% are females while 48.20% are males.
Analyzing the average score of all the students on the basis of “race/ethnicity”, “parental level of education”, “test preparation course”.

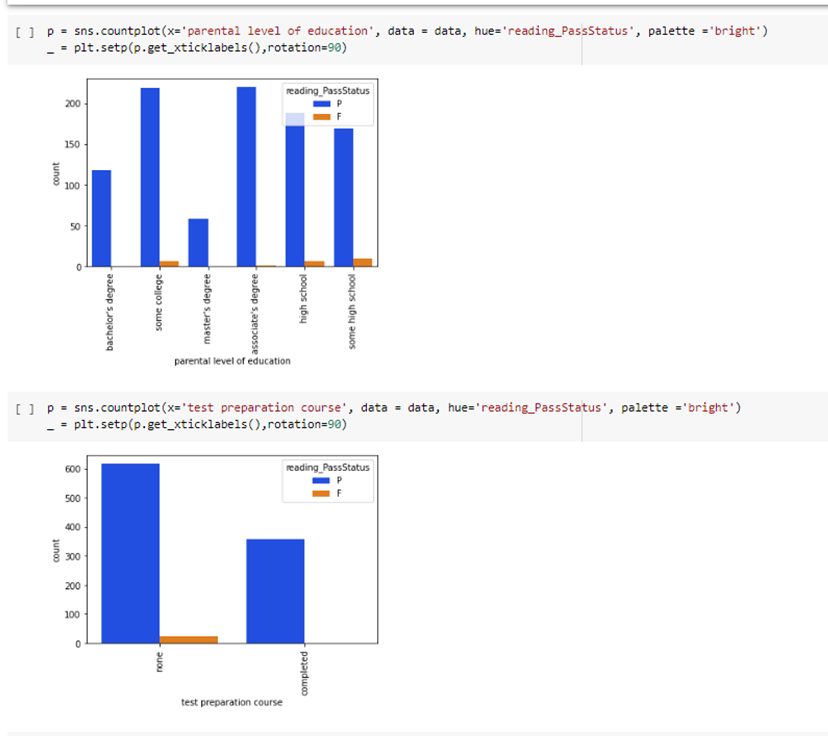
We can see the no. of students who passed or failed from the below code.