Performed Visualization & Analysis with NIFTY 50 Daily Data (2008 - 2023) .
- Brief Overall Analysis
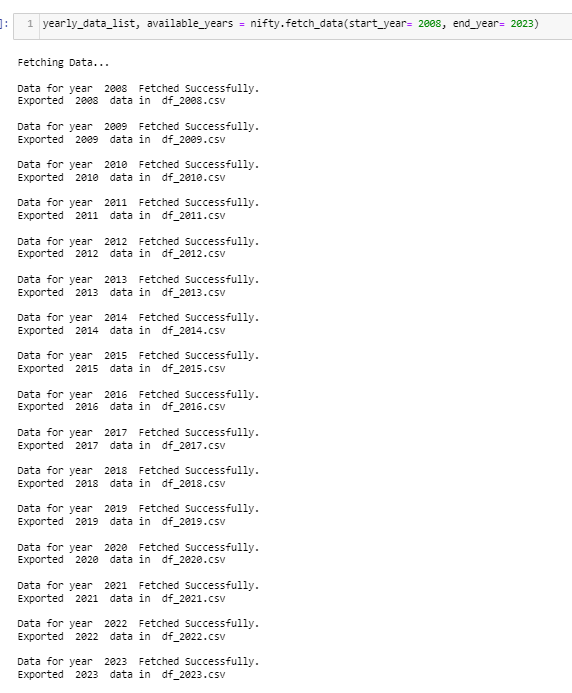
- Multiple Years Data Fetching with nsepy API & Storing Separate .csv
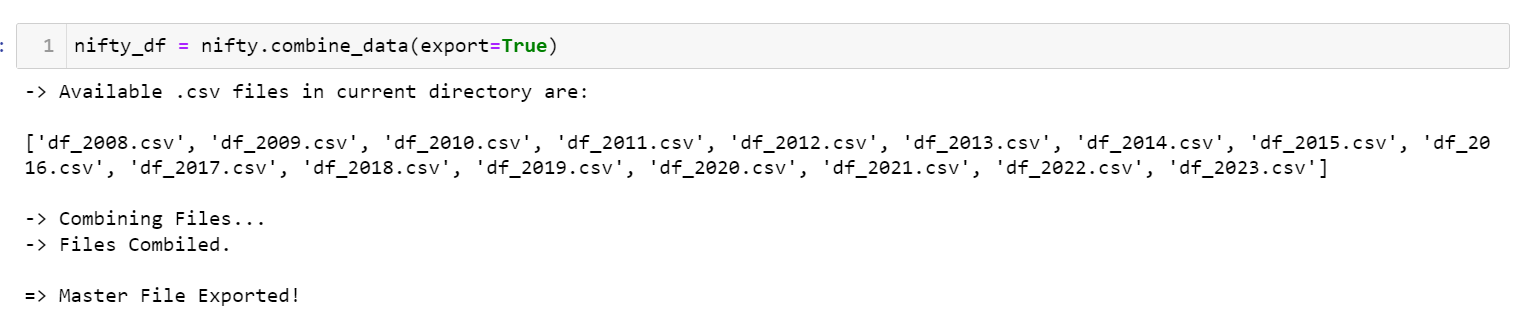
- Combining & Creating single Master Data from multiple Years Daily Data
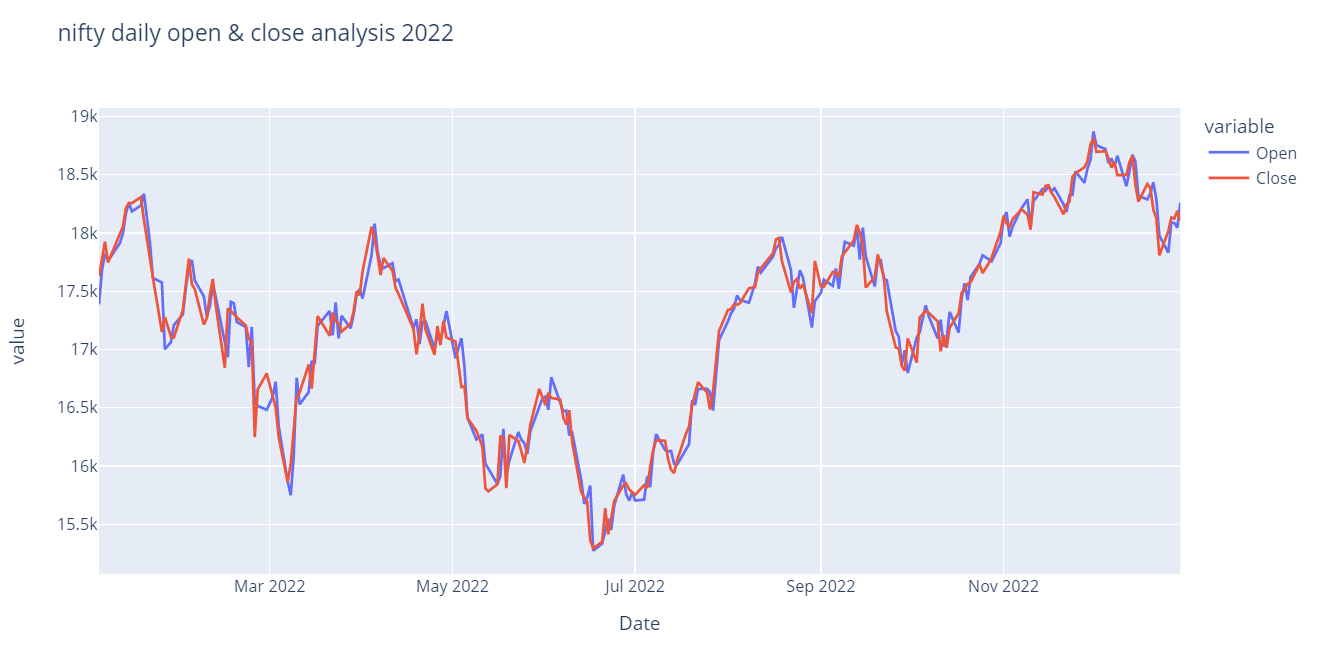
- Analysing Volume, High / Low , Open / Close over a Yearly & Monthly timeframe.
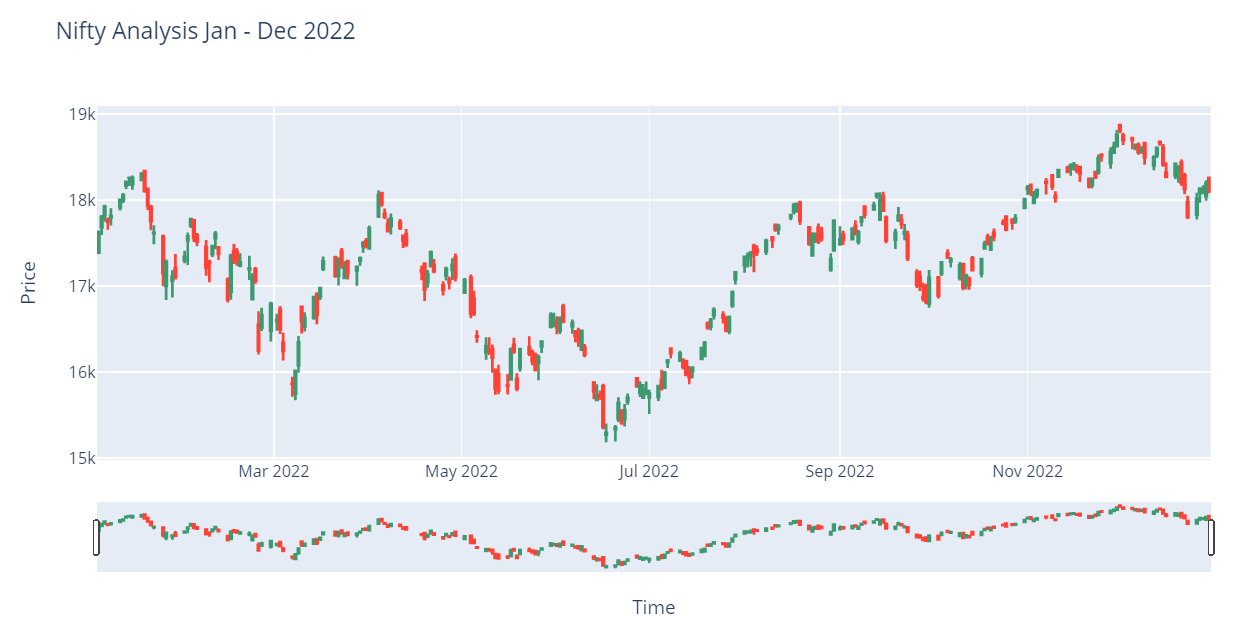
- Candle Sticks Charts (Thorughout, Yearly, Monthly)
- Gap Analysis
- Movement from Open Analysis
- Exponential Moving Average Analysis
- Heikin Ashi Charts (Thorughout, Yearly, Monthly)
- Line plots (Thorughout, Yearly, Monthly)
I'm a passionate Full Stack Data Sciences Practitioner from India.
If you have any feedback, please reach out to me at rithik.tripathi7@gmail.com

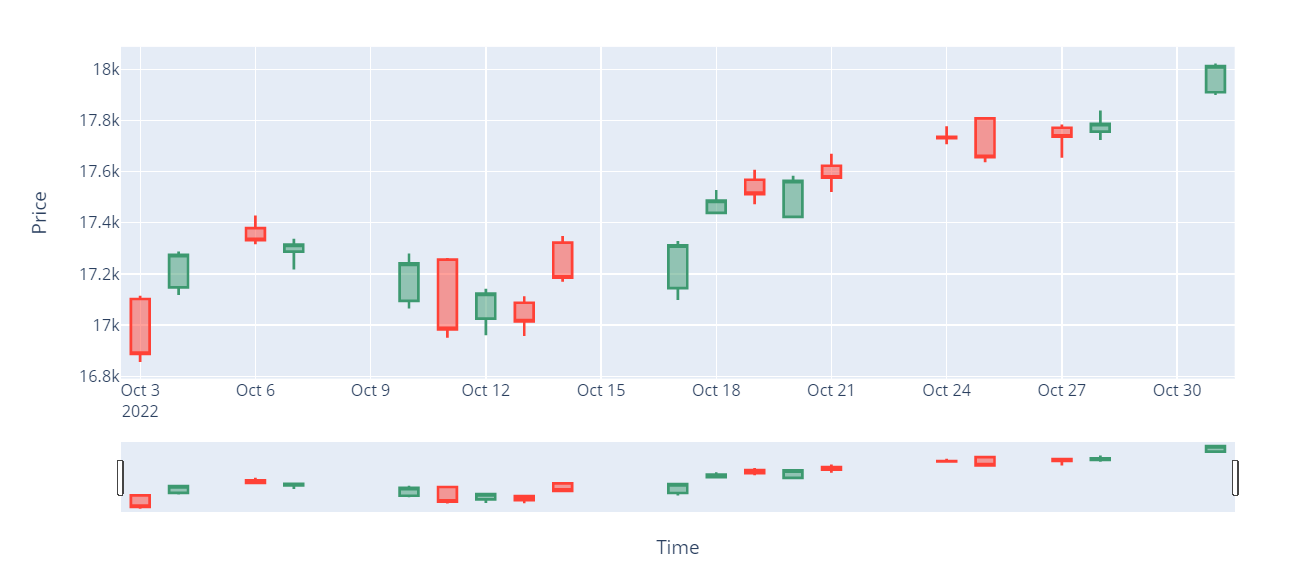

- Note: All these plots supports Pin and Zoom to particular timeframe out of the complete timeline .
Other Analysis like Gap Analysis, Heikin aashi, Movement from open could be seen in Attached notebook.