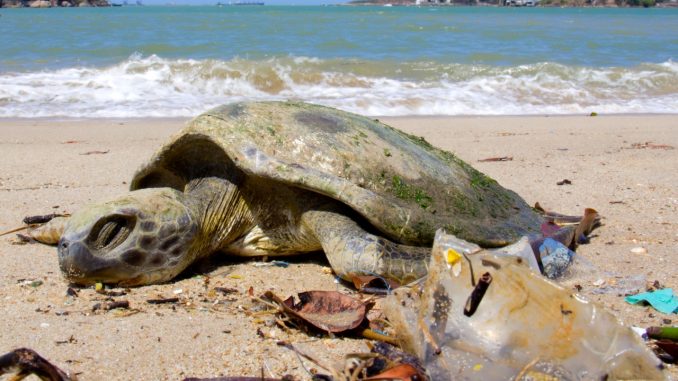
This repository hosts the Python script, related docs, and visualization results of our study on microplastic concentrations along the Brazilian coast for the Pale Blue Dot Challenge.
This repository is dedicated to our comprehensive study on the concentration of microplastics along the Brazilian coastline. Our team, H2Plastic, has conducted an extensive analysis using data collected by NASA's satellite to illustrate the impact of microplastics on marine biodiversity and human health.
Our research highlights the increasing presence of microplastics in the ocean, which poses a significant threat to aquatic life and humans, especially those in vulnerable communities. We've processed 18 months of data from April 2017 to September 2018, revealing alarming levels of microplastic contamination across various states in Brazil.
The study also incorporates cultural insights, such as the significance of seafood consumption in these regions and its implications on public health. Our findings are crucial for government agencies to formulate cleaning policies and raise public awareness about the risks associated with microplastic pollution.
- Data Processing: We used Python with libraries such as Xarray for handling NetCDF4 files, NumPy for numerical analysis, and Matplotlib for plotting.
- Geospatial Visualization: Cartopy for mapping, with Matplotlib animation for creating dynamic visualizations.
- Data visualization: Figma was used for the creation of an interactive dashboard to display our data visualizations.
Anyone interested in accessing our interactive dashboard can simply click on the link below to explore our findings and visualizations:
Access our Interactive Dashboard
We welcome contributions and discussions. Feel free to open an issue or submit a pull request for any suggestions or questions.
For more information, please contact us through the email: h20plasticc@gmail.com.
