In EDA as soon as possible we get the raw data because the entire Features engineering is actually done on the raw data itself. So as soon as possible we get the raw we start doing the analysis now question arises here is that what kind of analysis we do ?
- Check how many numerical features may be there . (we try to see numerical features with the help of drawing of different diagrams like histogram , pdf function )
- Check categorical features ( In categorical features we are try the analyze category features like how many category feature may be there . In those feature may be we have multiple categories)
- Checking for missing values (For checking checking missing value just try to visualize all the graphs all these graphs )
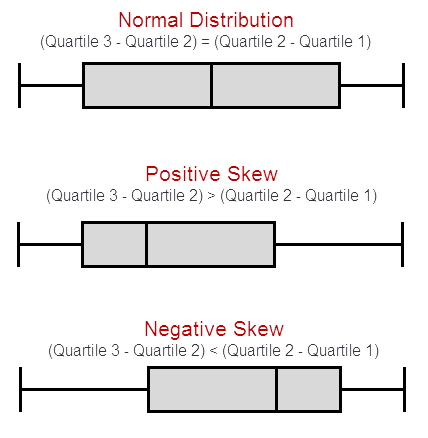
- Checking for outlier ( We can simply check whether there are outliers with help of box plot)
- Handling Missing values ( There are many ways to handel missing value like mean , mode , median and many more )
- Handling imbalanced Data Set
- Treating Outliers
- Scaling down the data (standardization and normalization)
- Converting categorical data to numerical data(One hot encoding, Label encoding)
Standardization is a scaling technique wherein it makes the data scale-free by converting the statistical distribution of the data into the below format:
- mean - 0 (zero)
- standard deviation - 1
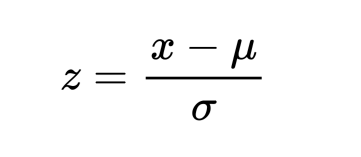
By this, the entire data set scales with a zero mean and unit variance, altogether.

We solve this missing value problem by replacing the NAN values with the Mean/ Median /Mode
- Mean: It is the average value
- Median: It is the midpoint value.
- Mode: Highest reapeted value or It is the most common value.
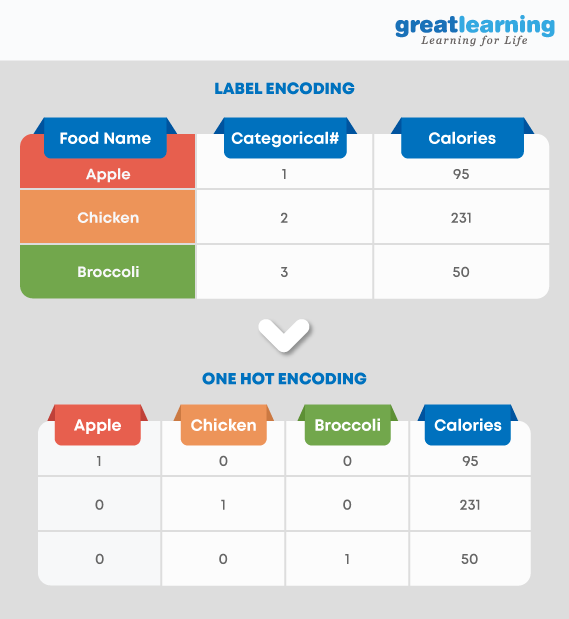
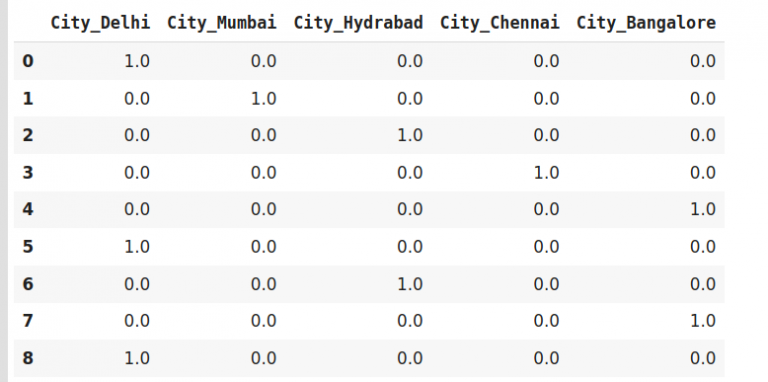
One-hot encoding One-hot encoding converts the categorical data into binary code as 0 and 1 by splitting the column into multiple columns.
Label encoding Label Encoding is converting labels/words into numeric form
Using one-hot encoding increases the dimensionality of the data set. Label encoding doesn’t affect the dimensionality of the data set. One-hot encoding creates a new variable for each level in the variable whereas, in Label encoding, the levels of a variable get encoded as 1 and 0.
People think that one-hot encoding and dummy-encoding are exactly the same thing, but that's not entirely true.
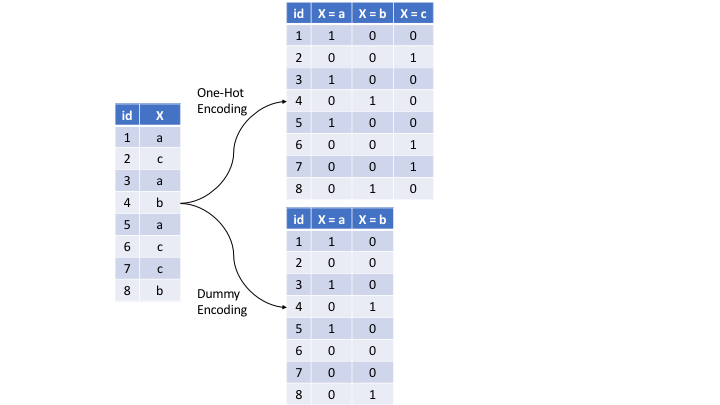
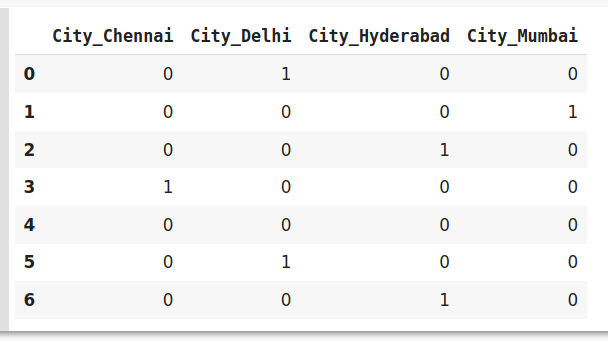
Often times people think that one-hot encoding and dummy-encoding are exactly the same thing, but that's not entirely true. If you use pandas pd.get_dummies() for dummy-encoding, the default value of the option drop_first is set to False, which basically results in one-hot encoding. But if you set drop_first = True, there are less generated columns, as one can see in the image.
- Nominal Categories Nominal categories are unordered e.g. colours, sex, nationality. Ordinal Categories
- Ordinal categories are ordered, e.g. school grades, price ranges, salary bands. source: https://benalexkeen.com/mapping-categorical-data-in-pandas/
One hot encoder and dummy encoder are two powerful and effective encoding schemes. They are also very popular among the data scientists, But may not be as effective when-
A large number of levels are present in data. If there are multiple categories in a feature variable in such a case we need a similar number of dummy variables to encode the data. For example, a column with 30 different values will require 30 new variables for coding. If we have multiple categorical features in the dataset similar situation will occur and again we will end to have several binary features each representing the categorical feature and their multiple categories e.g a dataset having 10 or more categorical columns. In both the above cases, these two encoding schemes introduce sparsity in the dataset i.e several columns having 0s and a few of them having 1s. In other words, it creates multiple dummy features in the dataset without adding much information.
Also, they might lead to a Dummy variable trap. It is a phenomenon where features are highly correlated. That means using the other variables, we can easily predict the value of a variable. Due to the massive increase in the dataset, coding slows down the learning of the model
One-Hot Encoding
#Fit and transform Data data_encoded = encoder.fit_transform(data) data_encoded
Dummy Encoding
#encode the data data_encoded=pd.get_dummies(data=data,drop_first=True) data_encoded
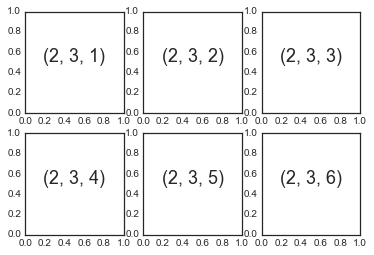
plt.subplot()
Nominal data is a data where we cant order any categoes in order. While ordinal data is a data where categories can be ordered in meaningful way. Nominal data include country, gender, race, hair color etc. of a group of people, while that of ordinal data includes having a position in class as “First” or “Second”
heat map to determine the correlation between multiple variables. It draw graphical representation of data as a matrix of columns and rows. Heat maps describ correlation among several numerical variables, visualizing patterns and anomalies. It measures both strength and direction of the linear relationship between variables. The correlation matrix shows how the variables are correlated to each other on a scale of -1 to 1, with 1 being a perfect positive correlation and -1 being a perfect inverse correlation.
A positive correlation exists when two variables operate in unison so that when one variable rises or falls, the other does the same. A negative correlation is when two variables move opposite one another so that when one variable rises, the other falls. Source : https://www.naukri.com/learning/articles/heatmap-in-seaborn/
- eg.
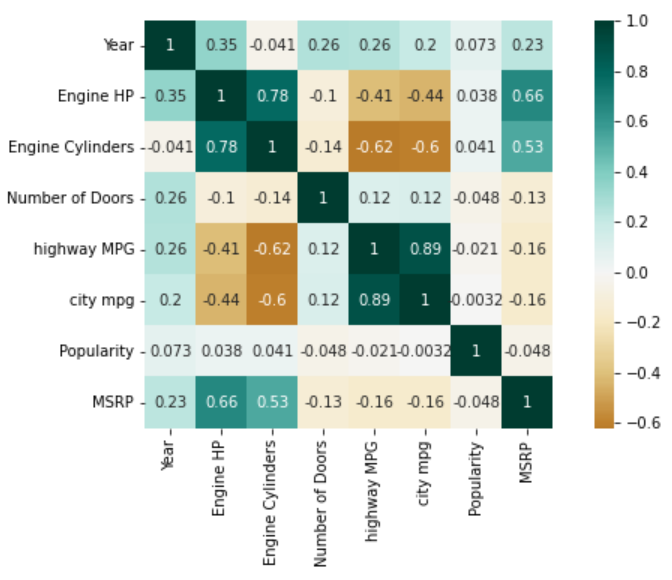
From our heatmap above, we can infer the following:
- Features ‘city mpg’ and ‘highway MPG’ have a strong positive correlation with a value of 0.89
- Features ‘Engine Cylinders’ and ‘Engine HP’ also have a strong positive correlation with a value of 0.78
- Another positive correlation is between features ‘Engine Cylinders’ and ‘Engine HP’ with feature ‘MSRP’. The values being 0.53 and 0.66 respectively
- Feature ‘Engine Cylinders’ has a strong negative correlation with features ‘city mpg’ and ‘highway MPG’ with values -0.6 and -0.62 respectively
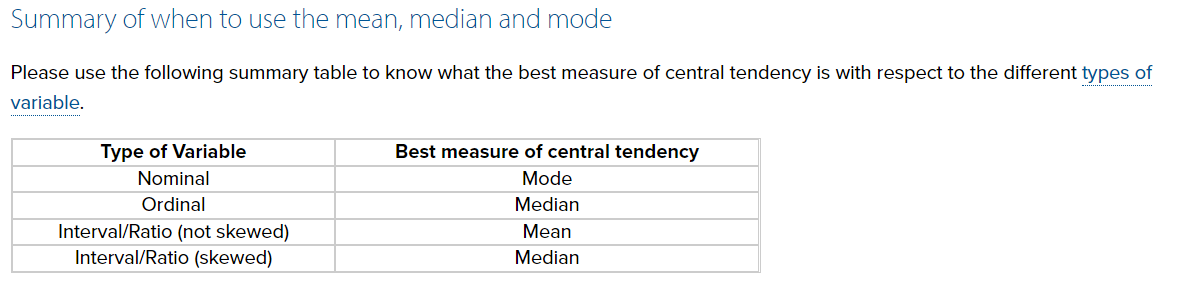
- What is the best measure of central tendency?
- There can often be a "best" measure of central tendency with regards to the data you are analysing, but there is no one "best" measure of central tendency. This is because whether you use the median, mean or mode will depend on the type of data you have (see our Types of Variable guide), such as nominal or continuous data; whether your data has outliers and/or is skewed; and what you are trying to show from your data. Further considerations of when to use each measure of central tendency is found in our guide on the previous page.
- In a strongly skewed distribution, what is the best indicator of central tendency?
- It is usually inappropriate to use the mean in such situations where your data is skewed. You would normally choose the median or mode, with the median usually preferred. This is discussed on the previous page under the subtitle, "When not to use the mean".
- Does all data have a median, mode and mean?
- Yes and no. All continuous data has a median, mode and mean. However, strictly speaking, ordinal data has a median and mode only, and nominal data has only a mode. However, a consensus has not been reached among statisticians about whether the mean can be used with ordinal data, and you can often see a mean reported for Likert data in research.
- When is the mean the best measure of central tendency?
- The mean is usually the best measure of central tendency to use when your data distribution is continuous and symmetrical, such as when your data is normally distributed. However, it all depends on what you are trying to show from your data.
- When is the mode the best measure of central tendency?
- The mode is the least used of the measures of central tendency and can only be used when dealing with nominal data. For this reason, the mode will be the best measure of central tendency (as it is the only one appropriate to use) when dealing with nominal data. The mean and/or median are usually preferred when dealing with all other types of data, but this does not mean it is never used with these data types.
- When is the median the best measure of central tendency?
- The median is usually preferred to other measures of central tendency when your data set is skewed (i.e., forms a skewed distribution) or you are dealing with ordinal data. However, the mode can also be appropriate in these situations, but is not as commonly used as the median.
- What is the most appropriate measure of central tendency when the data has outliers?
- The median is usually preferred in these situations because the value of the mean can be distorted by the outliers. However, it will depend on how influential the outliers are. If they do not significantly distort the mean, using the mean as the measure of central tendency will usually be preferred.
- In a normally distributed data set, which is greatest: mode, median or mean?
- If the data set is perfectly normal, the mean, median and mean are equal to each other (i.e., the same value).
- For any data set, which measures of central tendency have only one value?
- The median and mean can only have one value for a given data set. The mode can have more than one value
We often test whether our data is normally distributed because this is a common assumption underlying many statistical tests. An example of a normally distributed set of data is presented below:
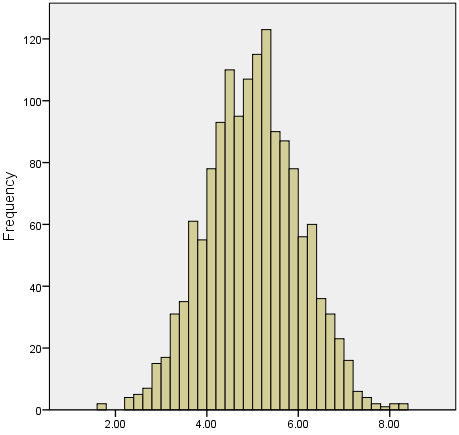
When you have a normally distributed sample you can legitimately use both the mean or the median as your measure of central tendency. In fact, in any symmetrical distribution the mean, median and mode are equal. However, in this situation, the mean is widely preferred as the best measure of central tendency because it is the measure that includes all the values in the data set for its calculation, and any change in any of the scores will affect the value of the mean. This is not the case with the median or mode.
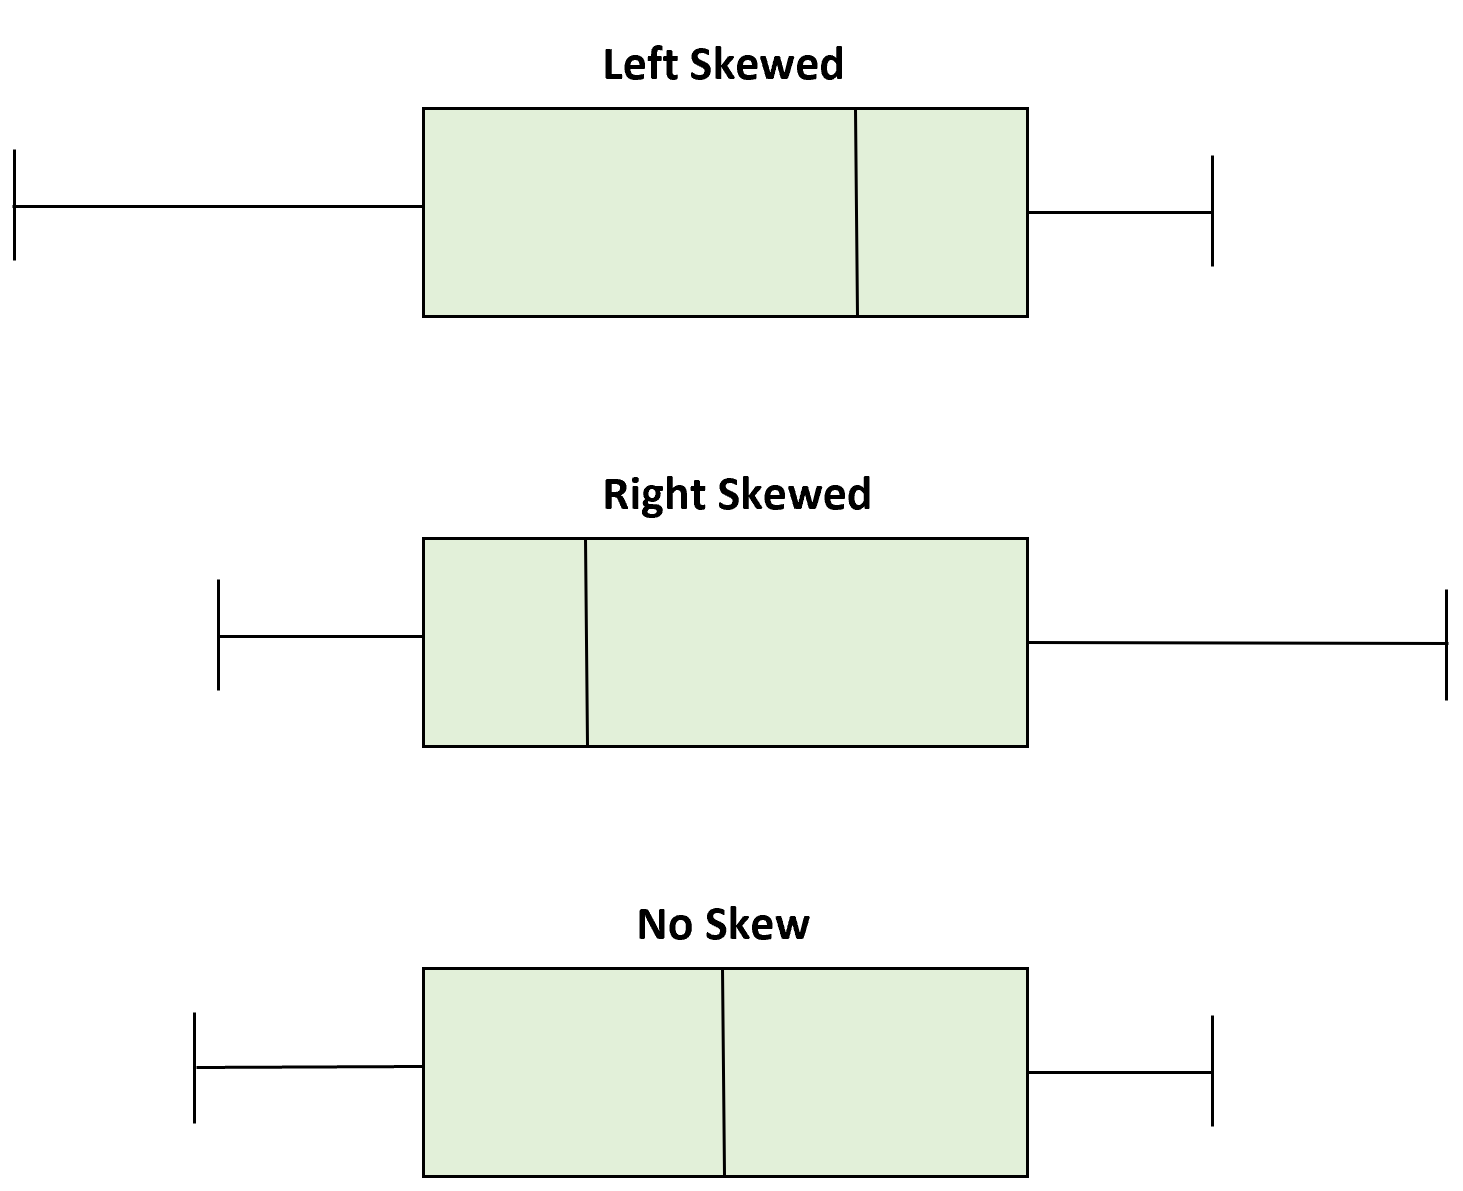
However, when our data is skewed, for example, as with the right-skewed data set below:
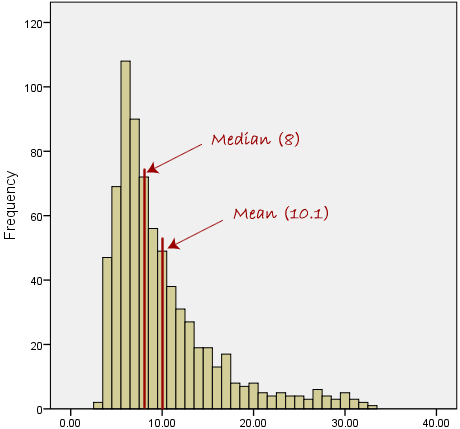
We find that the mean is being dragged in the direct of the skew. In these situations, the median is generally considered to be the best representative of the central location of the data
Source : https://statistics.laerd.com/statistical-guides/measures-central-tendency-mean-mode-median.php
ML Project reffe : https://www.kaggle.com/code/harshjain123/step-by-step-ml-project/notebook#-STROKE-RISK-PREDICTION- https://www.kaggle.com/code/pariaagharabi/step-by-step-fetal-health-prediction-99-detailed https://www.kaggle.com/code/harshjain123/step-by-step-ml-project/notebook https://www.kaggle.com/code/harshjain123/breast-cancer-exploratory-data-analysis