Fix 3d plot in introduction/05-formatting_plots #66
Conversation
This file contains hidden or bidirectional Unicode text that may be interpreted or compiled differently than what appears below. To review, open the file in an editor that reveals hidden Unicode characters.
Learn more about bidirectional Unicode characters
|
This is the right way. |
|
Ok nice, I have rebuilt that tutorial. |
Sign up for free
to join this conversation on GitHub.
Already have an account?
Sign in to comment
Add this suggestion to a batch that can be applied as a single commit.
This suggestion is invalid because no changes were made to the code.
Suggestions cannot be applied while the pull request is closed.
Suggestions cannot be applied while viewing a subset of changes.
Only one suggestion per line can be applied in a batch.
Add this suggestion to a batch that can be applied as a single commit.
Applying suggestions on deleted lines is not supported.
You must change the existing code in this line in order to create a valid suggestion.
Outdated suggestions cannot be applied.
This suggestion has been applied or marked resolved.
Suggestions cannot be applied from pending reviews.
Suggestions cannot be applied on multi-line comments.
Suggestions cannot be applied while the pull request is queued to merge.
Suggestion cannot be applied right now. Please check back later.
This change fixes the plotting error, and produces this plot:
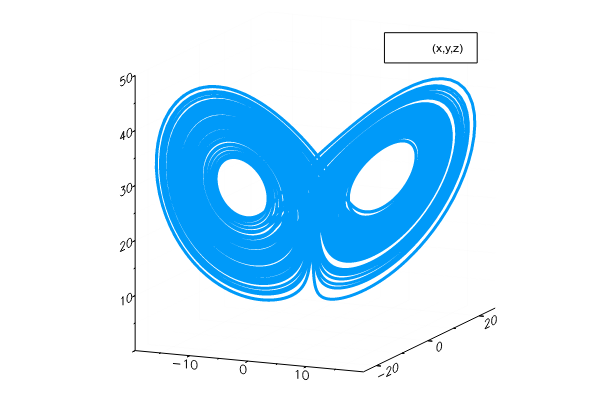
@ChrisRackauckas If this is the way to do it, let me know. I will rebuild that tutorial and add the result to this PR. Note that
plot(sol, vars=[:x, :y, :z])(as suggested in SciML/DifferentialEquations.jl#478?) also compiles, but produces the same plot as the first one from that tutorial.