Skip to content

ShellyChoudhury/Python_Visualization

Repository files navigation

Company Saels data Visualization using Python(Numpy,pandas and Matplotlib )

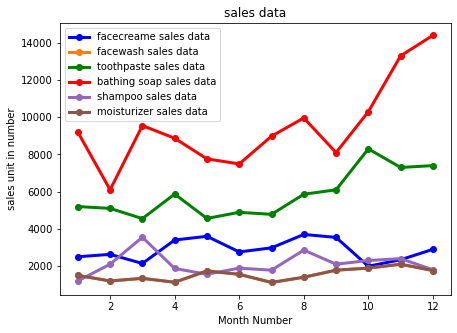
The company sales data contains total sales and total profits of 6 products for beauty and hyigene month wise. Visualizations were plotted using Matplotlib in python.

Reading Total profit of all months and showing it using a line plot

output_0_1

Reading all products sales data and showing it using a multiline plot

output_0_0

Reading toothpaste sales data of each month and showing it using a scatter plot

output_0_1

Reading face cream and facewash product sales data and showing it using the bar chart.

output_0_1

Reading sales data of bathing soap of all months and showing it using a bar chart.

output_0_0

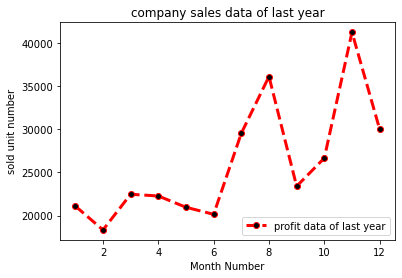
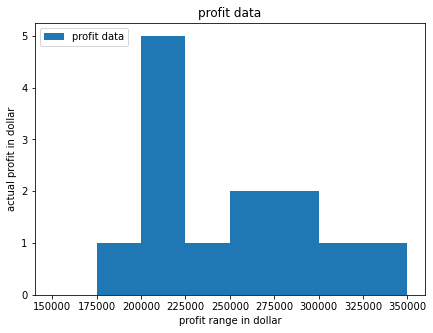
Reading the total profit of each month and showing it using the histogram to see most common profit ranges

output_0_0

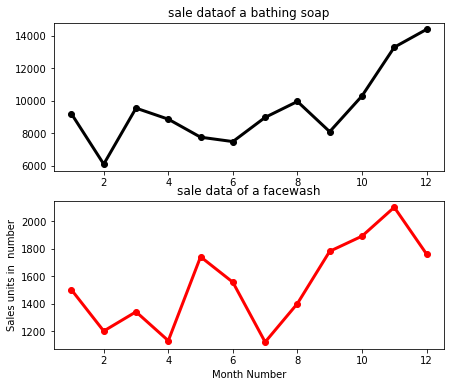
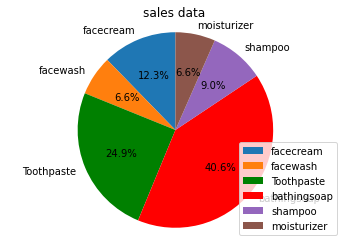
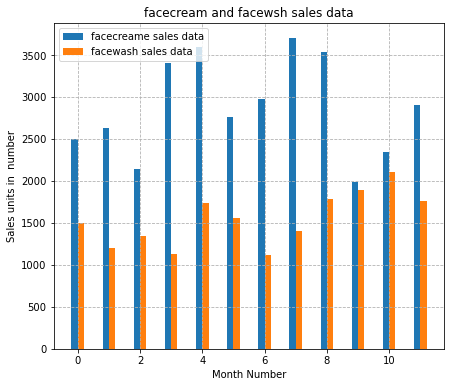
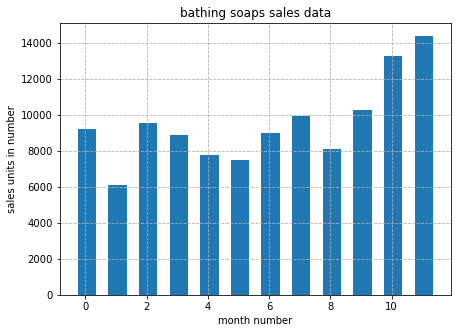
Calculating total sale data for last year for each product and showing it using a Pie chart10. Read Bathing soap facewash of all months and display it using the Subplot

output_0_0

Calculating total sale data for last year for each product and showing it using a Pie chart

output_0_0

Reading all product sales data and showing it using the stack plot

output_0_0

About

Visulization plots for Real-Estate data

Resources

Stars

Watchers

Forks

Releases

No releases published

Packages

No packages published