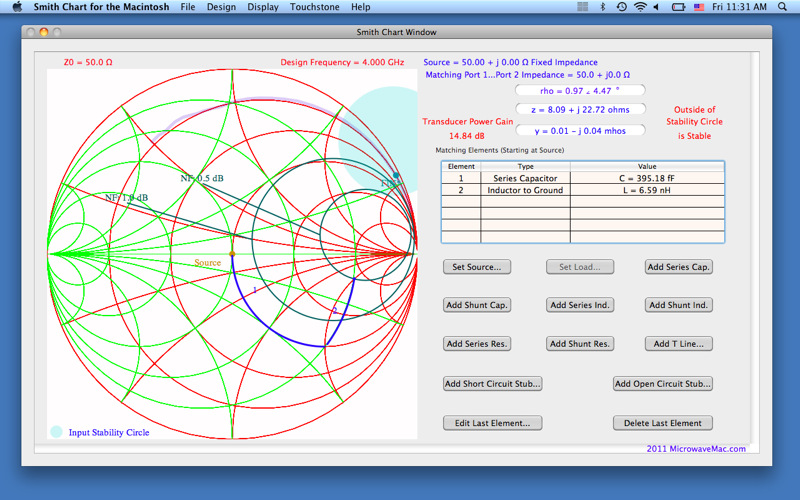
The Smith Chart is one of the most powerful tools in RF and microwave engineering. This macOS-native Smith Chart application provides a modern, interactive way to analyze complex impedances, reflection coefficients, and transmission line parameters.
Instead of relying on static paper charts or manual plotting, engineers and students can interactively move points, calculate impedance matching networks, and visualize scattering parameters (S-parameters) in real time.
The tool is indispensable for:
- Designing impedance matching circuits for antennas and RF devices.
- Visualizing the behavior of transmission lines and waveguides.
- Teaching RF engineering fundamentals in an intuitive, visual way.
Smith Chart analysis bridges theory and practice in high-frequency engineering. This app was built to replicate and expand on the classic Smith Chart paper method but with dynamic computational accuracy.
-
Interactive Plotting
Plot reflection coefficients, impedance, and admittance directly on the chart. Points update dynamically as you input values. -
Matching Networks
Explore single-stub and double-stub matching, LC networks, and quarter-wave transformers visually. -
Transmission Line Calculations
Compute VSWR, return loss, insertion loss, and visualize line behavior for different terminations and lengths. -
Educational Mode
Toggle grid layers, markers, and coordinate transformations to better understand Smith Chart fundamentals. -
Data Import
Import S-parameter data from simulation or measurement software (e.g., Touchstone files).
- Plot impedances and admittances in normalized or absolute form.
- Real-time display of reflection coefficient magnitude and angle.
- Automatic conversion between impedance (Z), admittance (Y), and reflection coefficient (Γ).
- Support for common network types: series/shunt capacitors, inductors, stubs.
- VSWR circles and constant resistance/reactance circles.
- Export plots as images for reports or publications.
- Touchstone file compatibility for real-world RF design.
- RF Engineers — Matching antenna feeds, amplifiers, filters, and transmission lines.
- Microwave Specialists — Waveguide and high-frequency design optimization.
- Students — Learning reflection coefficients, impedance matching, and network theory visually.
- Educators — Demonstrating Smith Chart principles interactively in class.
- Researchers — Rapid prototyping and validation of RF network designs.
- Normalize your impedance with respect to system impedance (50Ω default).
- Enter impedance or reflection coefficient in the app → point appears on chart.
- Add matching components (L, C, stubs) → chart shows trajectory.
- Optimize until you reach the center (perfect match).
- Export graph as image or save project for reuse.
Smith Charts map complex reflection coefficients onto a unit circle. This app supports:
- Impedance (Z) and Admittance (Y) planes.
- Γ = (Z – Z₀) / (Z + Z₀) conversion.
- S-parameters for one-port and two-port devices.
- VSWR (Voltage Standing Wave Ratio) representation.
- Support for passive/active loads and frequency sweep visualization.
The algorithms follow classic RF design references (Pozar, Collin) and are benchmarked against standard Smith Chart tables.
The Smith Chart is a cornerstone of RF education. This macOS app enhances learning by:
- Showing live transformations as impedances are modified.
- Helping visualize concepts like conjugate matching, VSWR, and stub tuning.
- Replacing tedious manual plotting with interactive exploration.
- Allowing side-by-side comparison of theoretical and measured S-parameters.
“Excellent for quick impedance matching tasks. Saves hours compared to manual charts.”
— RF Systems Engineer
“Our students finally ‘get’ Smith Charts thanks to this app.”
— Professor of Microwave Engineering
“Simple, accurate, and lightweight. Perfect for antenna design and lab use.”
— Telecom Engineer
- Multi-frequency sweep visualization.
- Advanced two-port network analysis with cascading.
- Direct link to vector network analyzers (VNA).
- Expanded export formats (CSV, PDF reports).
- Cloud sync for saving projects across devices.
Smith Chart software is provided as a calculation and visualization tool. Results are accurate within the limits of provided models. Users must validate designs with measurements before deployment in real-world systems.
- macOS 10.12 Sierra or later
- Intel or Apple Silicon Mac
- 4 GB RAM minimum
- Works offline
- Recommended for macOS users in RF/Microwave field
Does it support both impedance and admittance plotting?
Yes — you can switch between Z and Y domains instantly.
Can I import Touchstone files?
Yes — one-port and two-port S-parameter files are supported.
Is this a teaching tool or a professional tool?
Both. It is accurate for engineering use and simple enough for classrooms.
Does it run on Apple Silicon?
Yes, fully compatible.
smith chart mac • rf impedance calculator • smith chart software macos • microwave engineering tool • transmission line calculator • impedance matching tool • s-parameter visualization • vswr circles smith chart • reflection coefficient mac app • rf design tool mac • smith chart for students • rf teaching tool macos • antenna matching mac • smith chart plotting software • electronics engineering smith chart • rf admittance calculator • smith chart visualization tool • rf simulation mac • smith chart reactance resistance • smith chart normalized impedance • vector network analyzer smith chart • passive load matching mac • stub tuner smith chart • microwave theory tool macos • smith chart engineering bundle • rf matching toolkit mac • telecom smith chart macos • electronics classroom smith chart • professional smith chart software


