This repository hosts projects where PostgreSQL and SQLite were using in conjunction with R/Python (run in a Jupyter Notebook environment), to either query, modify, or create a database.
SQLite and R were used to query a database (chinook.db), to answer a variety of business questions for a music company to help them make better business decisions, pertaining to:
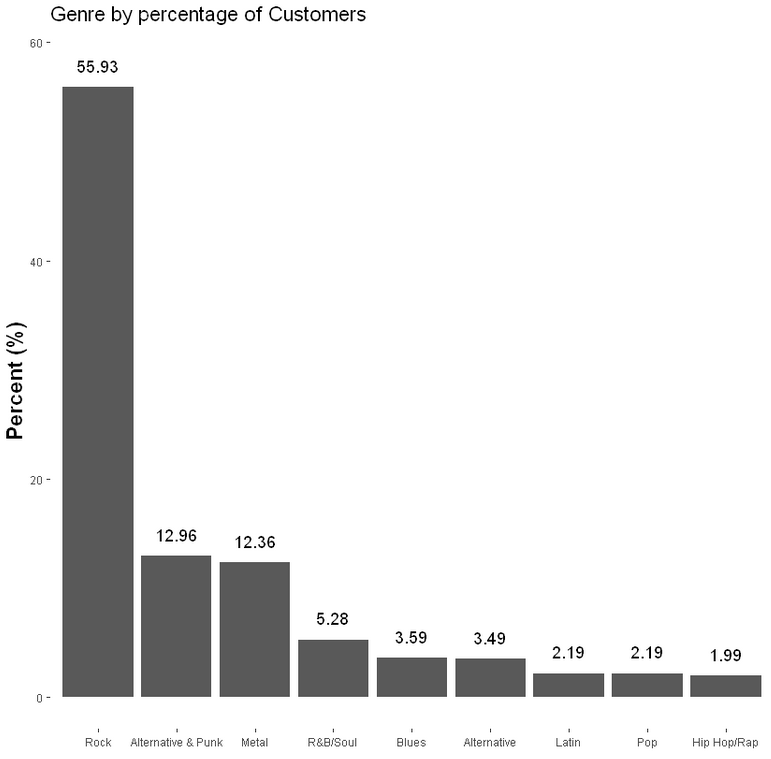
- Determining Genre Popularity
Gauging which genres were the most popular, the margins by which popularity varied, and also additional questions like whether it might be worth looking into a genre you don't have available because of its popularity.
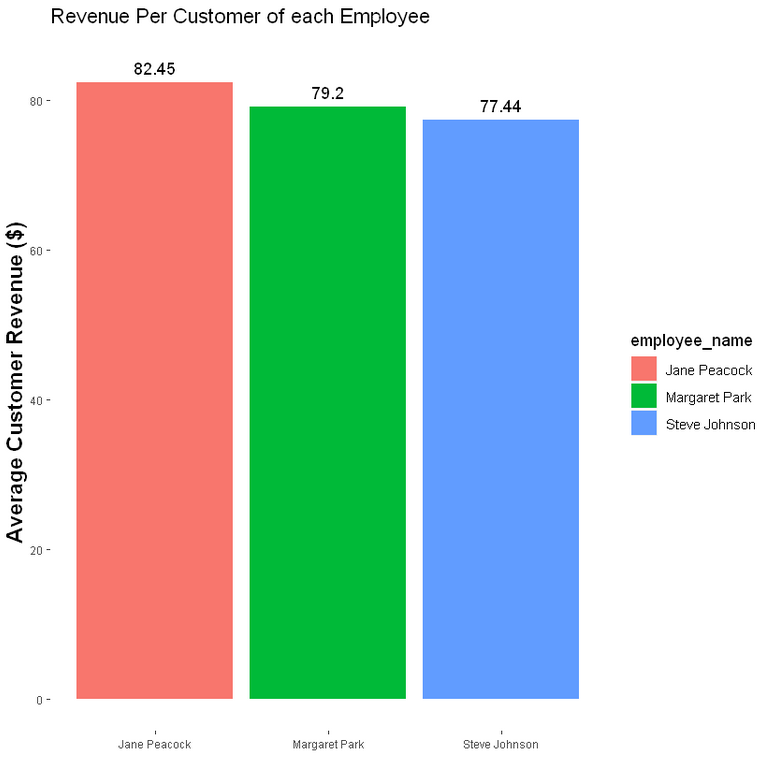
- Employee Performance
Comparing employee performance based on a number of variables, like how much revenue they generate per customer served by them, how many tracks their customers on average purchase, and whether there's a correlation between their duration of employement, and their performance.
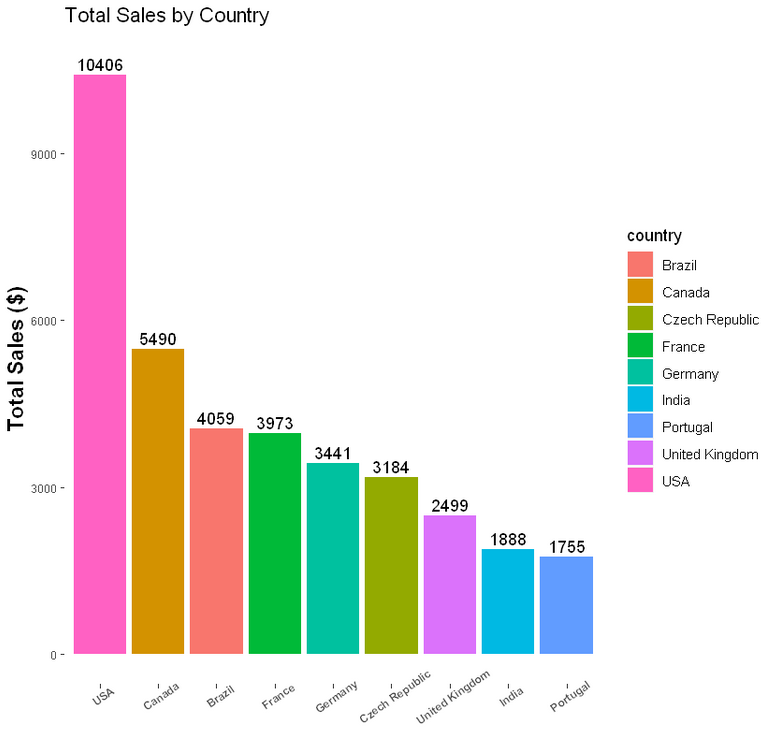
- Customer-base Demographics and Sales Revenue by Country
Learning more about how much sales revenue comes from each country, and how customer purchase behaviors might vary by country. We determined that there were some countries who did not contribute as much to the total company revenue, but whose residents tended to make much larger purchases than average, and determined that these were markets that might be worth focusing on more.
- Customer Purchase Behavior
Evaluated customer purchase behaviours (i.e. whether they purchased tracks separately or preferred to buy albums) and came to the conclusion that it was not worth altering the existing business practice of having a large amount of stocked albums, since nearly 20% of all sales, and 1/3rd of revenue entirely came from albums.
Visualizations depicting these findings were created through the ggplot2 library in R.
The factbook.db database built off information from the CIA World Factbook was queried to convert the information within the database into a form that makes it easier for us to learn about each country, particularly on the following aspects:
- population
- population growth rate
- population density.
After querying, the database was first briefly cleaned to disregard outlier countries that would have skewed the visualizations.
Since the factbook.db was from the year 2015, comparisons against present-day numbers to population density were also made.
-
Data from 4 different files was compiled and organized.
-
A normalized schema was then constructed to represent the most efficient way of representing the information from each database, organized such that redundancies and repetitions in data were minimized, and data integrity was maximized.
-
Essentially converted and normalized the initial data sets into several separate tables using SQL, and created a robust database of game-level statistics.

- Data was imported into SQL to create and populate the tables, to construct the finished database.