Repository navigation
Monitoring
As part of our monitoring effort there are certain key metrics which can serve as an early system for potential issues and also shed some light into the day to day performance of the cluster as a whole some of these metrics have been tracked using Azure Insights and pinned to the our dashboard in the Azure portal and are listed below:
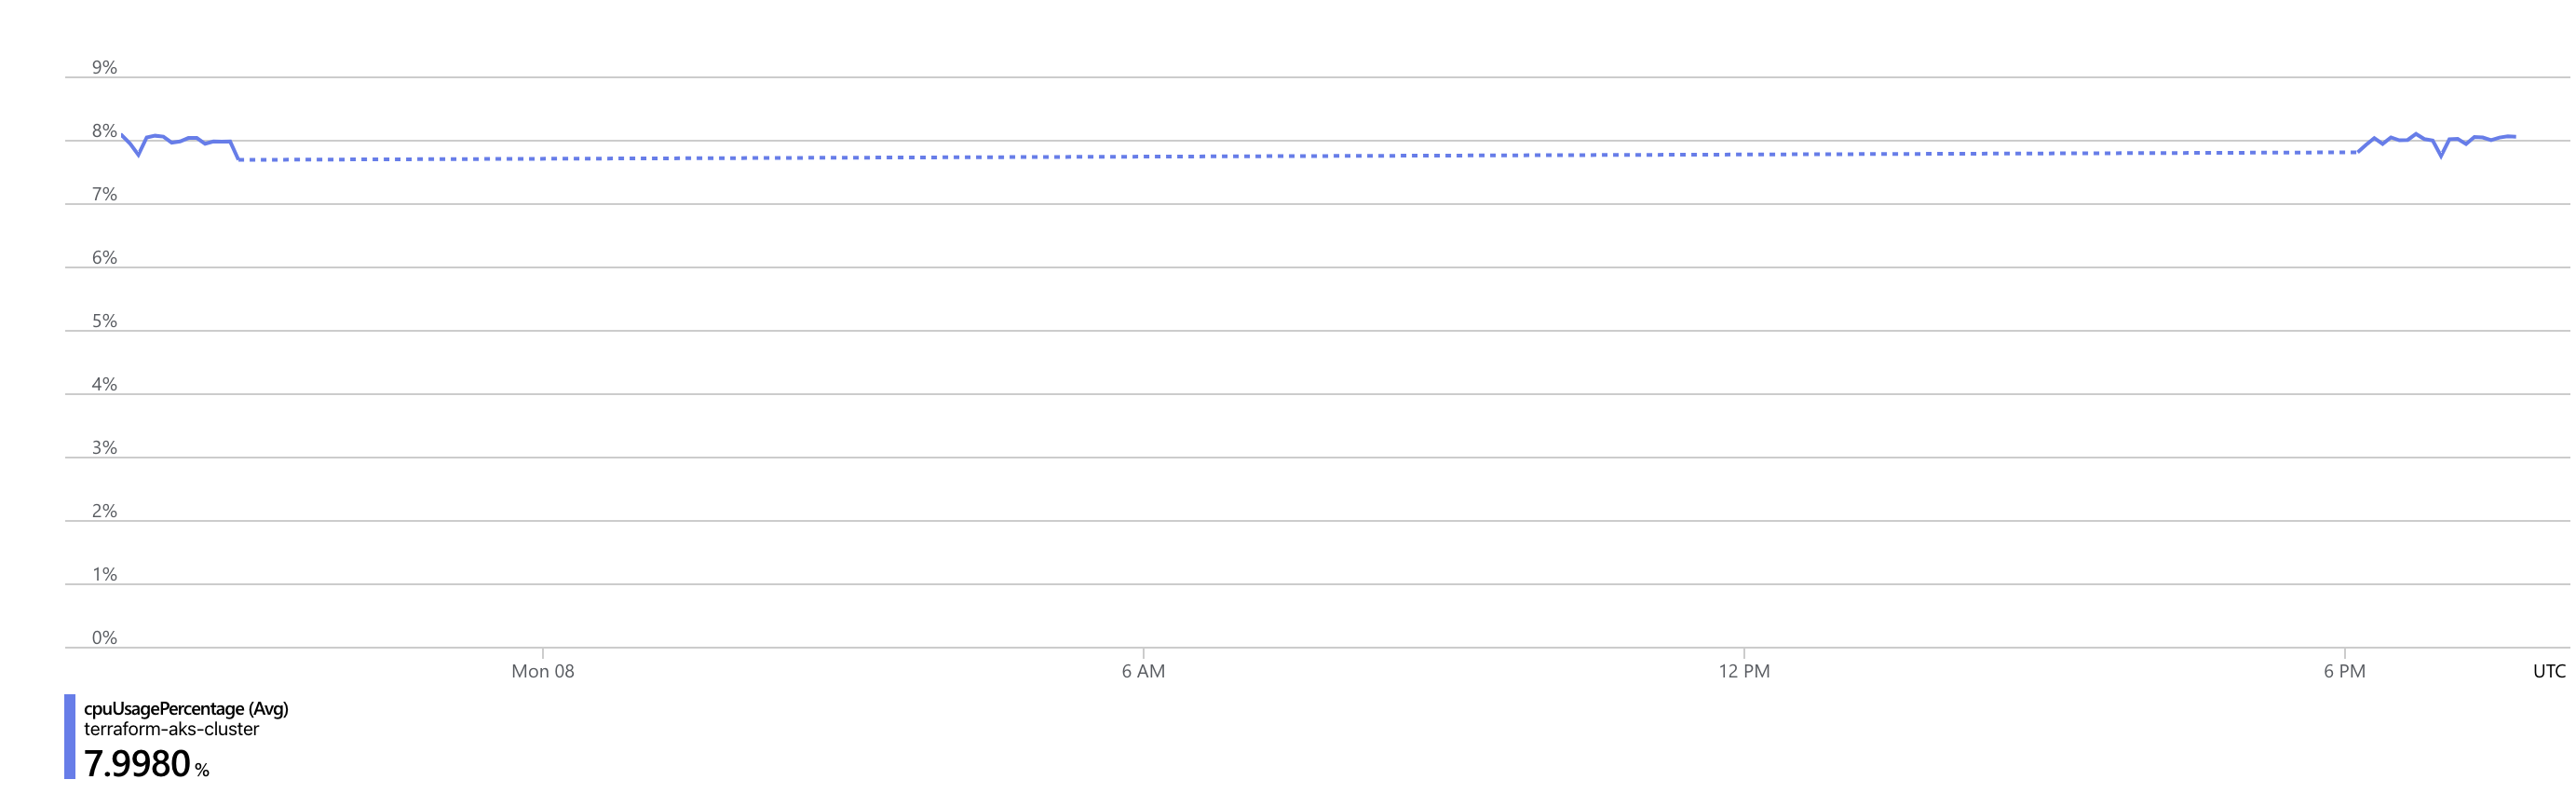
- Average Node CPU Usage: Tracks the CPU usage of the cluster's nodes. Monitoring CPU usage helps ensure efficient resource allocation and detect potential performance issues not only this but it can also serve as a vital point of reference when potential security threats arise.
-Average Pod Count: This chart displays the average number of pods running in your AKS cluster. It's a key metric for evaluating the cluster's capacity and workload distribution. -Used Disk Percentage: Monitoring disk usage is critical to prevent storage-related issues. This chart helps you track how much disk space is being utilized. -Bytes Read and Written per Second: Monitoring data I/O is crucial for identifying potential performance bottlenecks. This chart provides insights into data transfer rates.