Repository navigation
Monitoring
As part of our monitoring effort there are certain key metrics which can serve as an early system for potential issues and also shed some light into the day to day performance of the cluster as a whole some of these metrics have been tracked using Azure Insights and pinned to the our dashboard in the Azure portal and are listed below:
Tracks the CPU usage of the cluster's nodes. Monitoring CPU usage helps ensure efficient resource allocation and detect potential performance issues not only this but it can also serve as a vital point of reference when potential security threats arise.
 As can be seen in the graph above the only metric displayed is the Node CPU usage and can be represented by a solid line when there is data being received on the metric or a dashed line which indicates there is either missing data for the time period (e.g. a deployment on-going) or that there was issues retrieving the data for the specified time in the event there are large periods where data is missing this could be a potential indicator of issues within the cluster
This chart displays the average number of pods running within the cluster. It can be useful when trying to measure the cluster's capacity and workload distribution.
 This chart similarly to Node CPU tracks a single metric and does such to make it clean and readable, it will display the average number of healthy running pods within the cluster and will showcase the most activity during scaling and deployment events where the average may increase or decrease in line with the activity taking place. During deployments this chart can also be one of the first in which we may see a drop if there have been issues during the deployment e.g. pods with error status
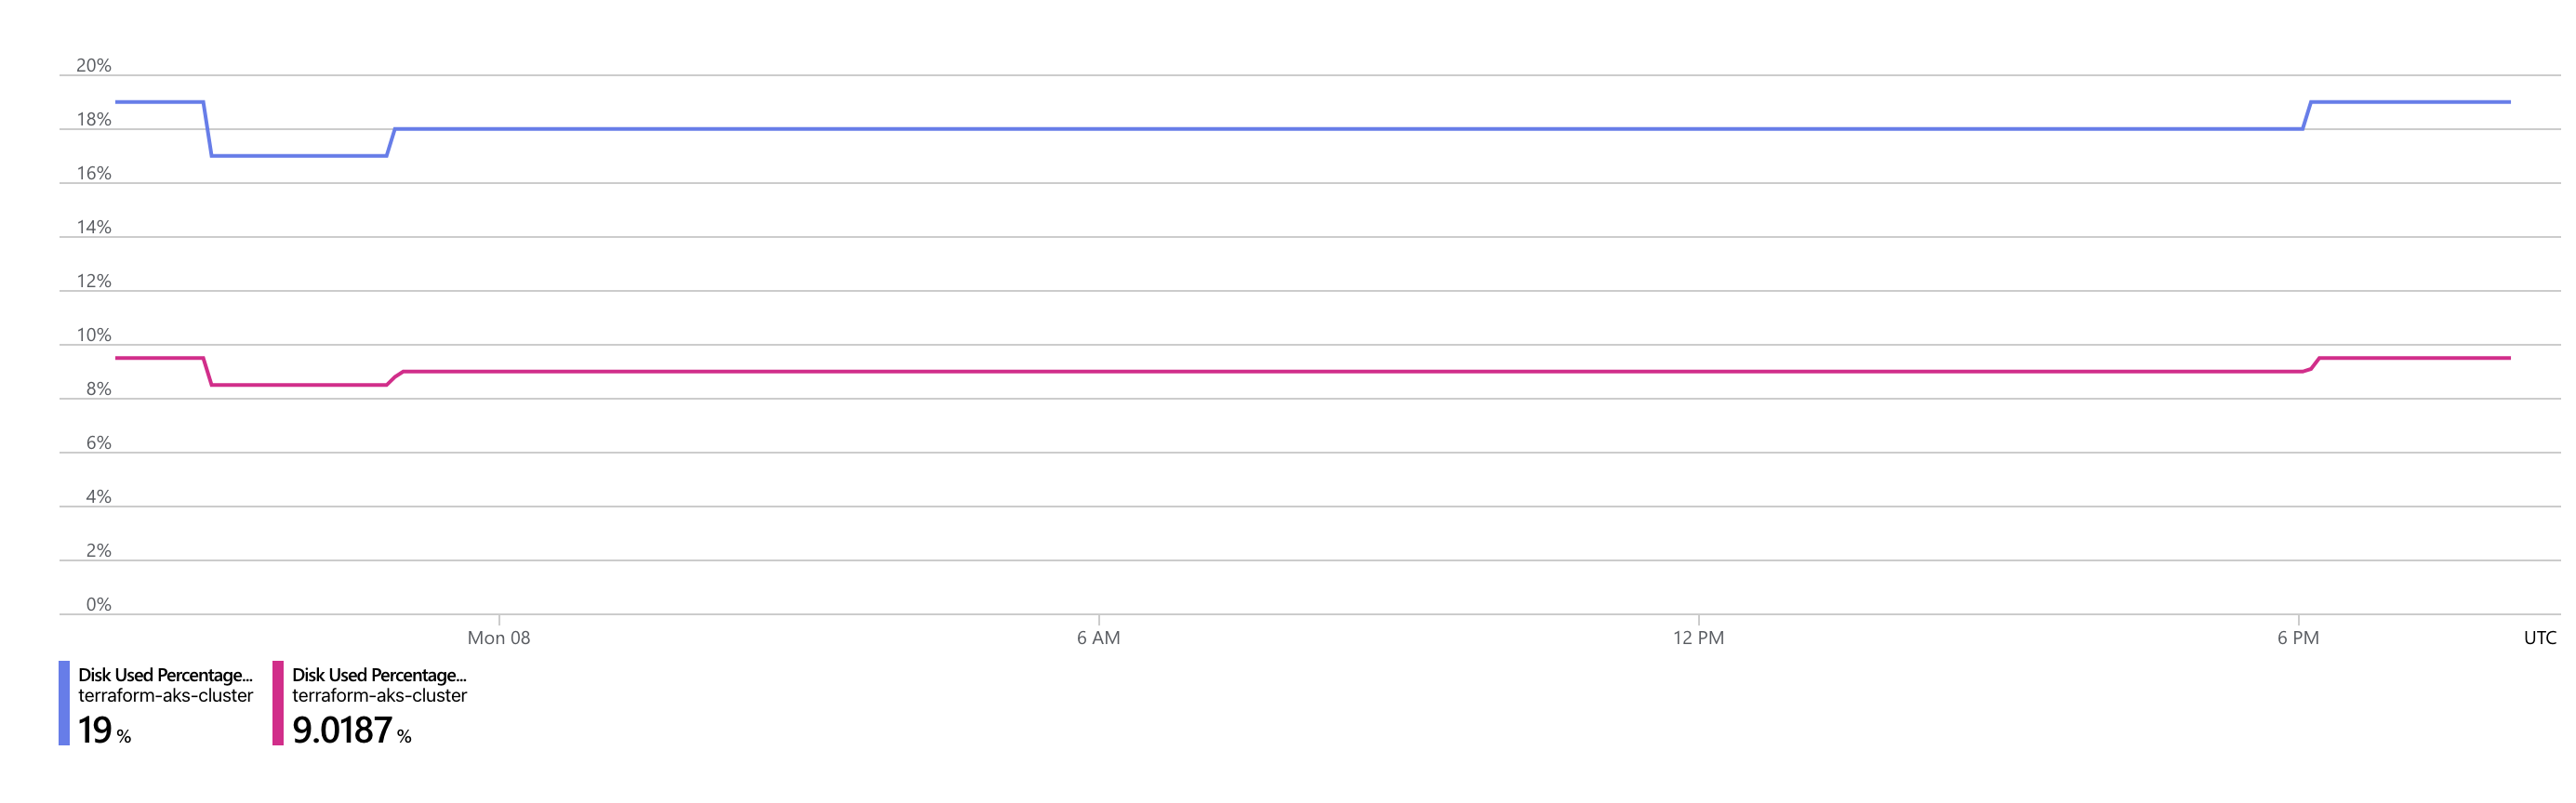
Monitoring disk usage is critical to prevent storage-related issues and so this chart allows us to monitor the active disk usage and view key point of increased activity and so from this data we can plan to scale accordingly, additionally this can also be a key metric when viewing cluster security as random spikes can indicate malicious activity
 We track two metrics within this chart one for the max disk usage for which we have an alert set up to notify when the disk usage has breached a specified threshold and additionally the average disk usage comparing these metrics against each other can prove to be useful in events where the alert has been triggered and can prove useful when making plans for the future off the cluster
Monitoring data I/O can prove vital when identifying potential performance bottlenecks. The purpose of this chart is to visual data transfer rates.