By Aaron Metsch (https://github.com/ametsch)
- DHT11 temperature and humidity sensor
- Arduino Uno compatible development board
- Computer running Windows 10, Windows 11, MACOS, or GNU/Linux with Arduino IDE 1.8 installed
- Male to male jumper wires
- Solderless breadboard
- USB cable to connect your board to your computer
- Photoresistor
- 10kΩ resistor
- Project code found at: https://bit.ly/3VB2Iwz
-
Install the neccesary Arduino libraries (How to install Arduino libraries):
-
Assemble everything as shown:
-
Downloading the code:
- Download the code from the link in the beginning of this document
- Open the Arduino IDE on your computer
- Click in the Arduino IDE window
- Click 'File' on the navigation bar
- Click 'Open'
- Navigate to the 'arduinoDHT.ino' file you just downloaded
- Click 'open' then click 'ok'
-
Code explanation:
- Start by including the neccesary libraries at the top of the file:
   #include "DHT.h" // Include DHT library
   #include "DHT_U.h" // Include DHT library
   #include "string.h" // Include arduino string library
- Next we define some constants (if you are not using a DHT11 replace it with the type of DHT you are using):
   #define DHTTYPE DHT11 // Define DHT type
   #define DHTPIN 5 // The arduino pin which is connected to the DHT data pin
   const int lightSensorPin = A0; // Define the arduino pin that the light sensor is connected to
- Next we create the
setupfunction to intialize everything:void setup() { Serial.begin(9600); // initialize the serial communication protocol dht.begin(); // initialize the DHT }
- Now we add the
loopfunction to tell the arduino to constantly check the temperature, humidity, and light level and print it to the serial monitor:void loop() { double f = dht.readTemperature(true); double h = dht.readHumidity(); double l = analogRead(lightSensorPin) / 5.0; String str = String(""); str.concat(String(f)); str.concat(", "); str.concat(String(h)); str.concat(", "); str.concat(String(l)); Serial.println(str); }
- Start by including the neccesary libraries at the top of the file:
-
Uploading the program to the Arduino
-
Connect the arduino to your computer over USB
-
In the Arduino IDE window click 'Tools' on the top navigation bar, then click 'Board', then click 'Arduino Uno'
-
Now click 'Tools' then 'Port' and select the option that appears
-
Click 'Sketch' on the top navigation bar, then click 'Upload' and wait until it says 'Done Uploading' on the bottom of the screen
-
Click 'Tools', then click 'Serial Monitor'
-
You should see data that looks like this:
   75.02, 25.00, 40.80
   75.02, 25.00, 40.80
   75.02, 25.00, 40.80
   75.02, 25.00, 40.00
   75.02, 25.00, 40.20
   75.02, 25.00, 40.00
-
-
(OPTIONAL) Graphing the data:
- Install Python 3 (>=3.9)
- Move the
requirements.txtandread2file.pyinto a new folder - Open your computer's command line and run the corrosponding commands:
- Powershell on Windows:
python -m pip install --upgrade pippip install -r {path}{path} = the path to the requirements.txt file from the github repository listed at the beginning of this document.python -m serial.tools.list_portsto list available portspython {path}{path} = the path to the read2file.py file from the github repository listed at the beginning of this document.
- Terminal on GNU/Linux or MacOS:
python3 -m pip install --upgrade pippython3 -m pip install -r {path}{path} = the path to the requirements.txt file from the github repository listed at the beginning of this document.python3 -m serial.tools.list_portsto list available portspython3 {path}{path} = the path to the read2file.py file from the github repository listed at the beginning of this document.
- Powershell on Windows:
- Enter the port your Arduino is on (from the Arduino IDE) e.g.
COM3, then press Enter - Enter how many reads you want it to perform in between the reads it saves a reading as a data point e.g.
100, then press Enter - Enter how many data points you want it to save e.g.
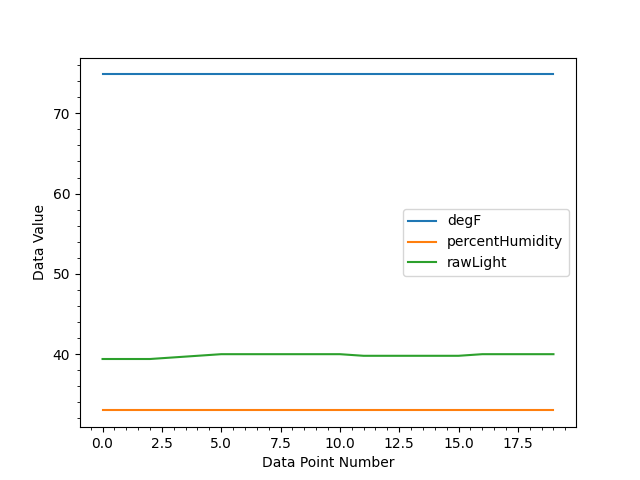
25, then press Enter - After it gathers all the data requested it will show you a graph of the data and output it to a csv and image of the graph.
Example Graph:
Copyright 2022 Aaron Metsch (https://github.com/ametsch)