-
Notifications
You must be signed in to change notification settings - Fork 14.5k
New issue
Have a question about this project? Sign up for a free GitHub account to open an issue and contact its maintainers and the community.
By clicking “Sign up for GitHub”, you agree to our terms of service and privacy statement. We’ll occasionally send you account related emails.
Already on GitHub? Sign in to your account
Implement the column config and row config in pivot table #4394
Implement the column config and row config in pivot table #4394
Conversation
in pivot table.

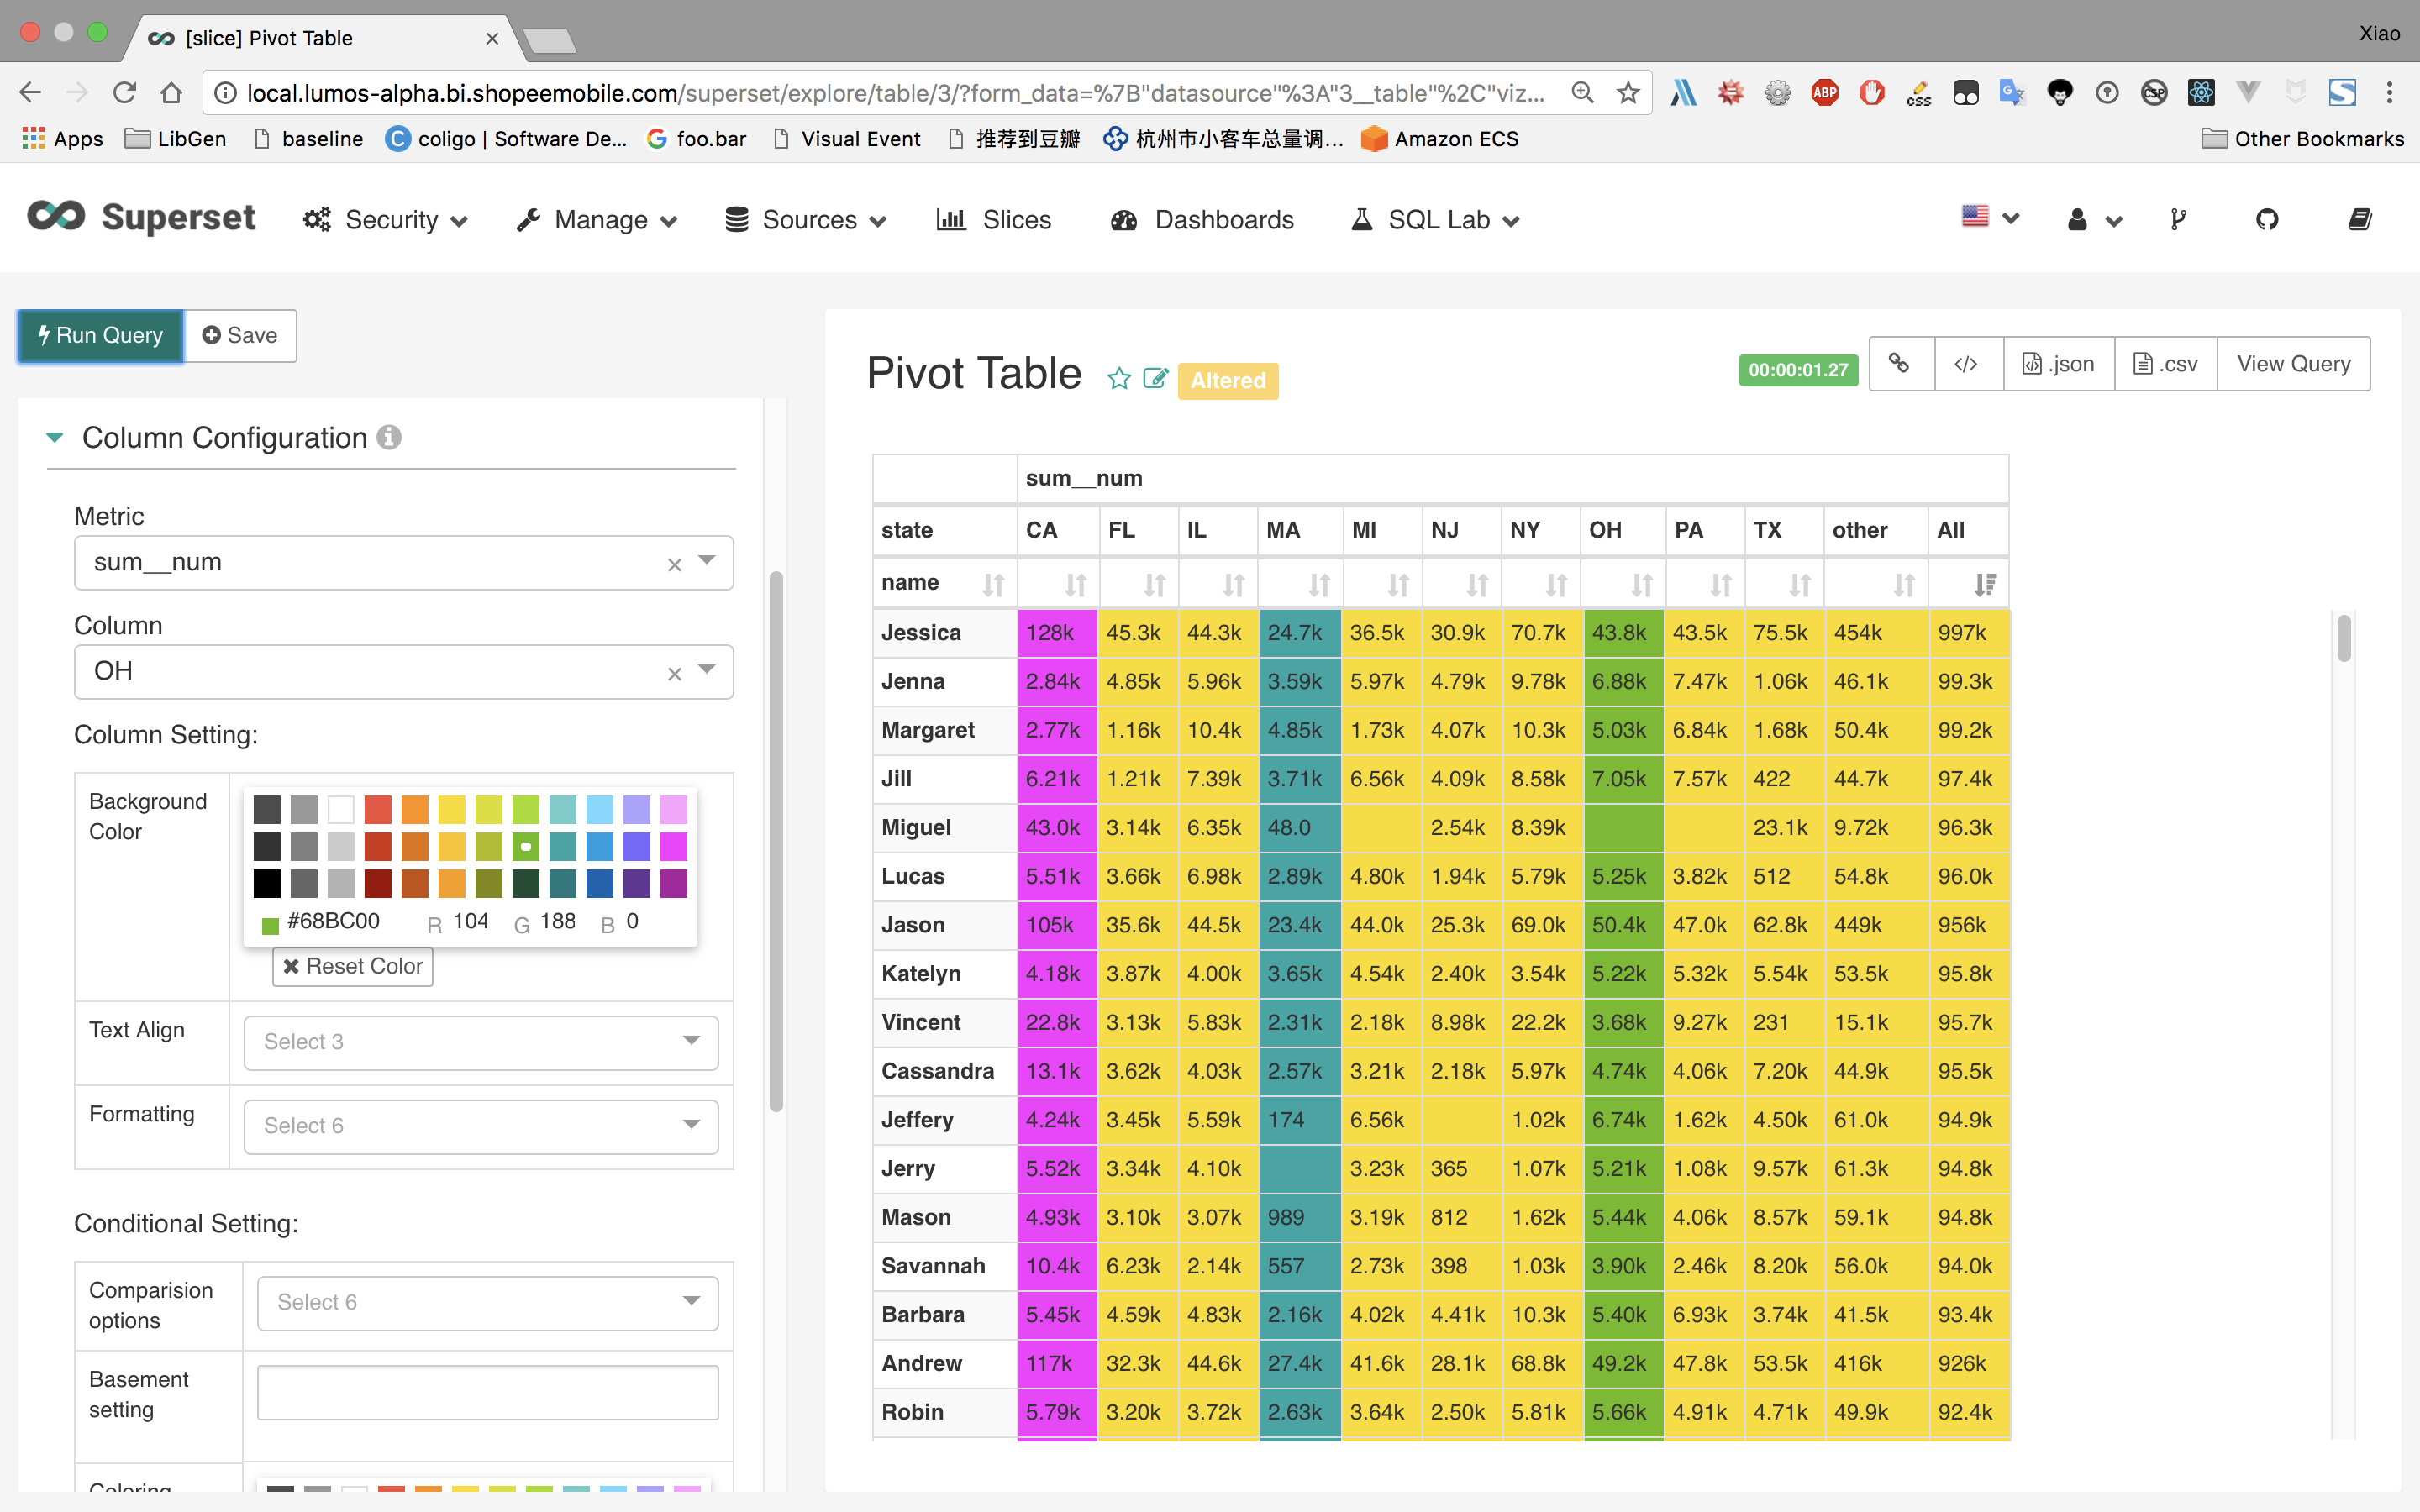
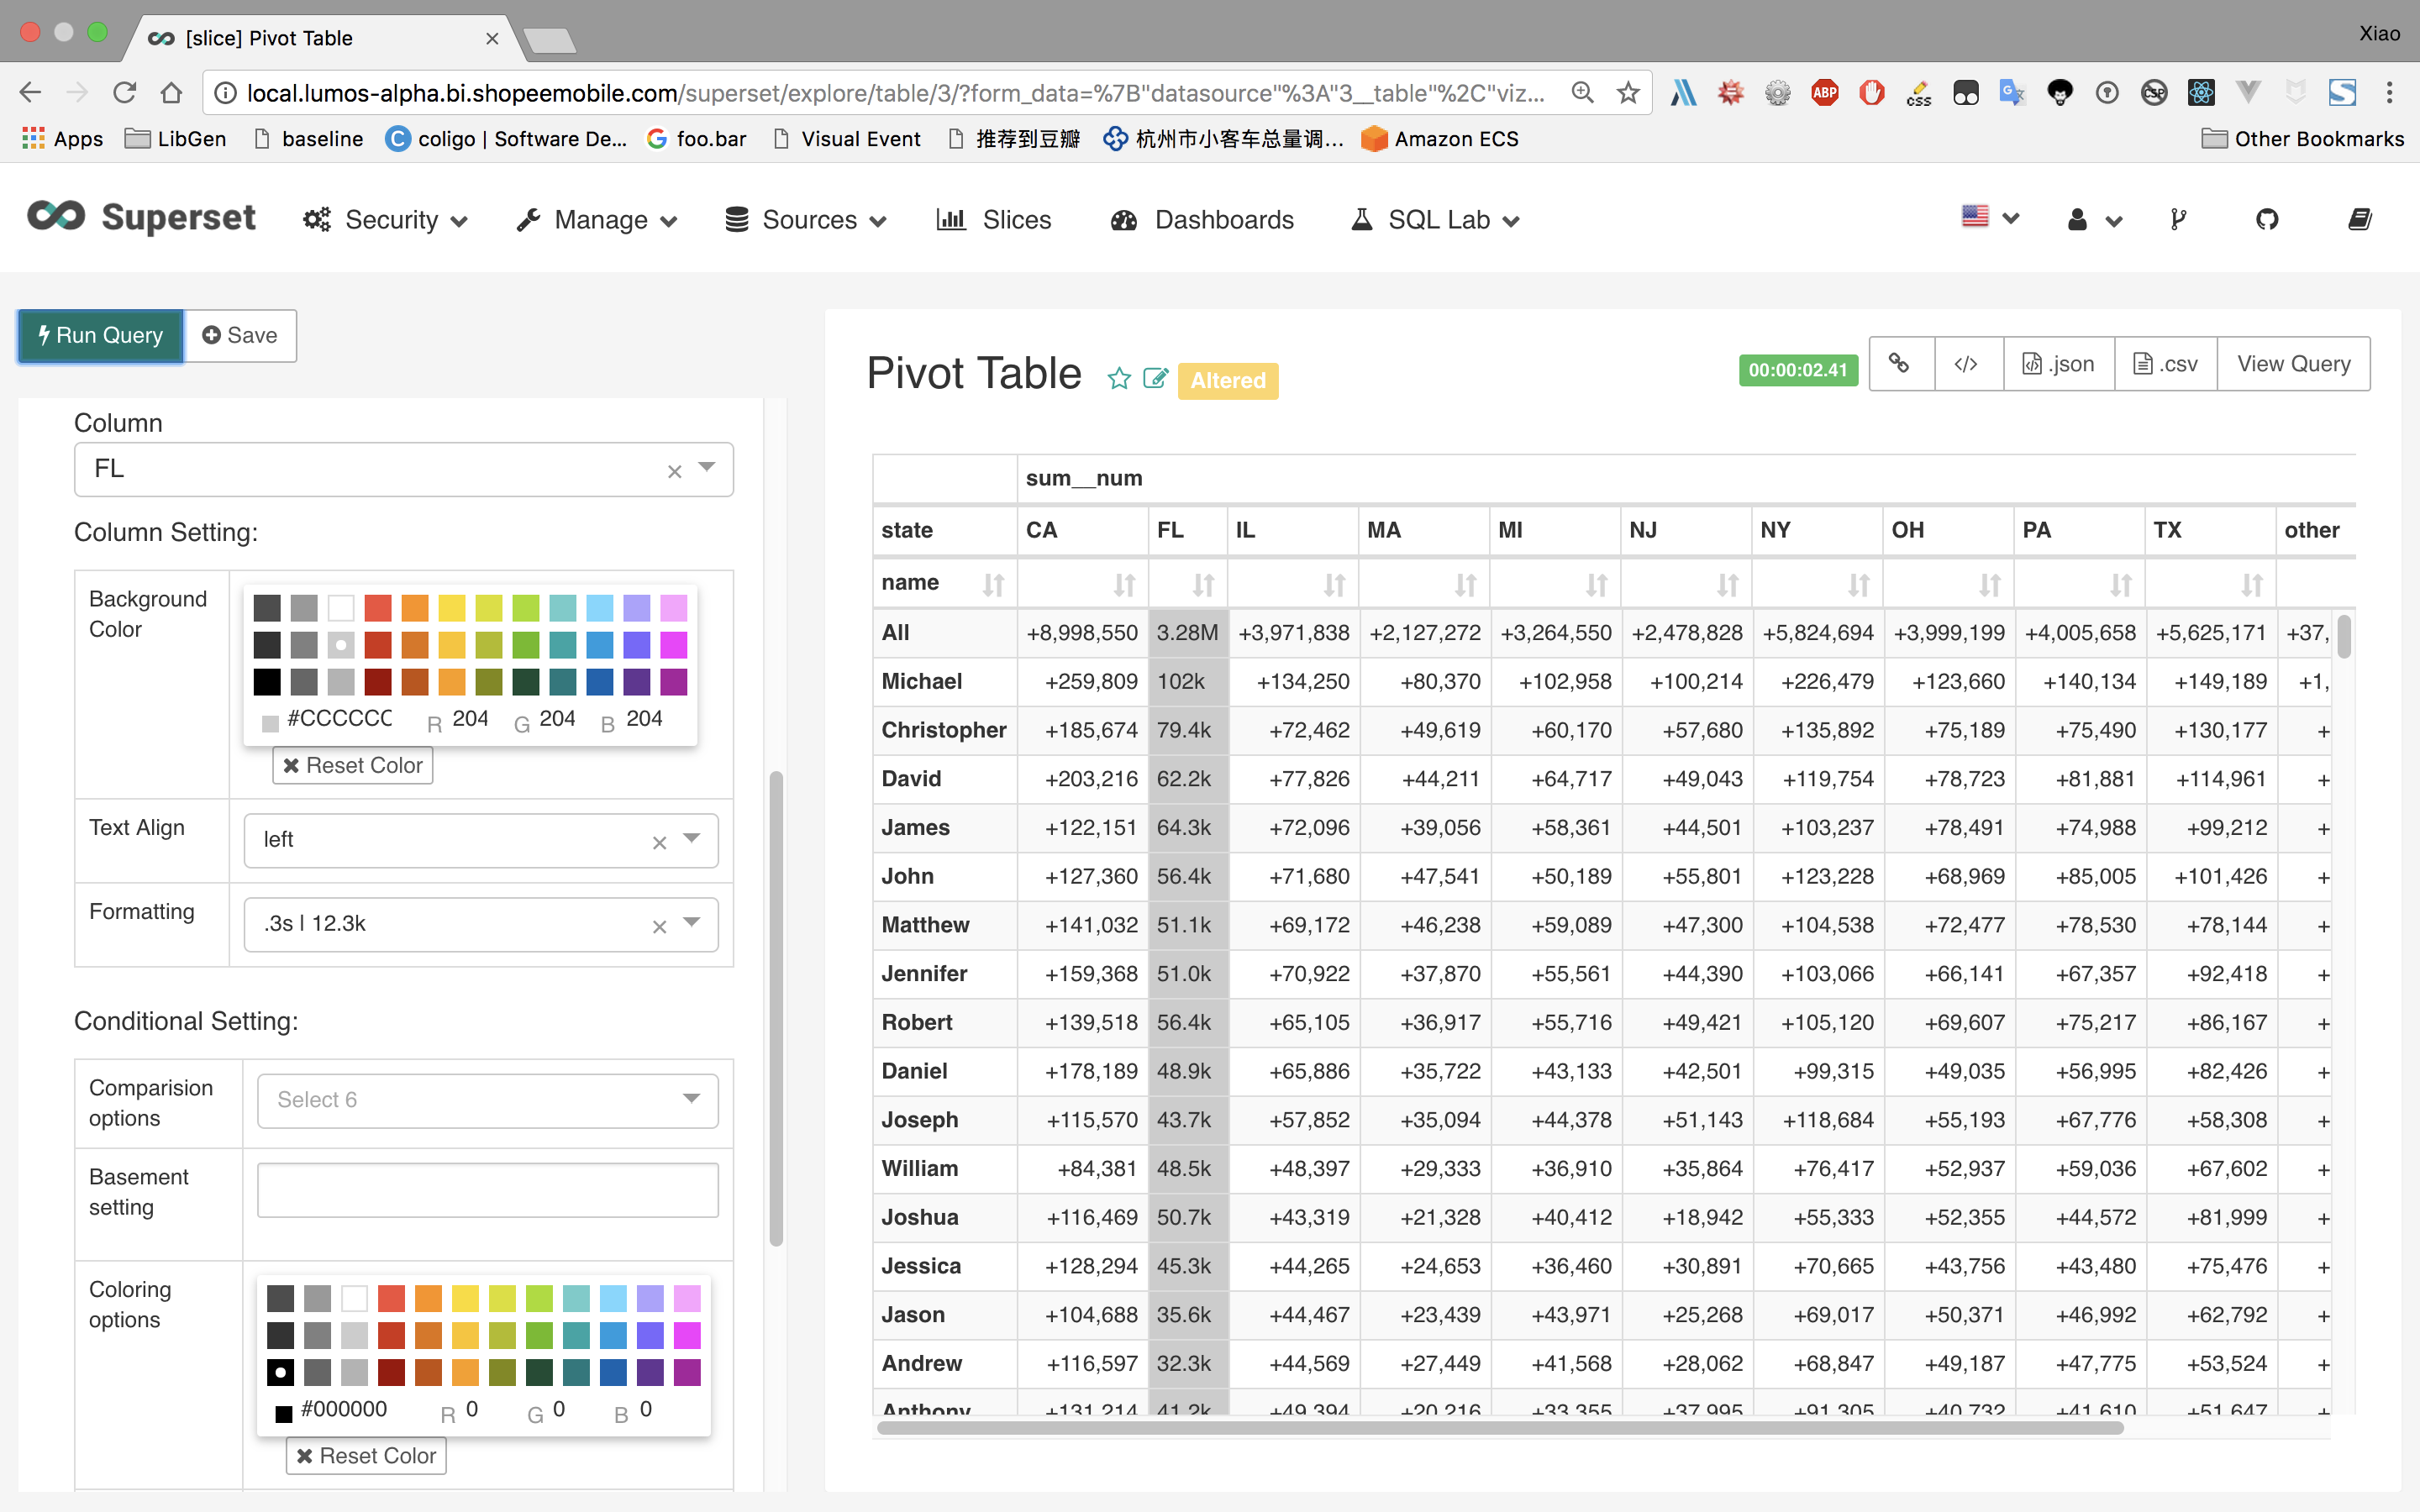
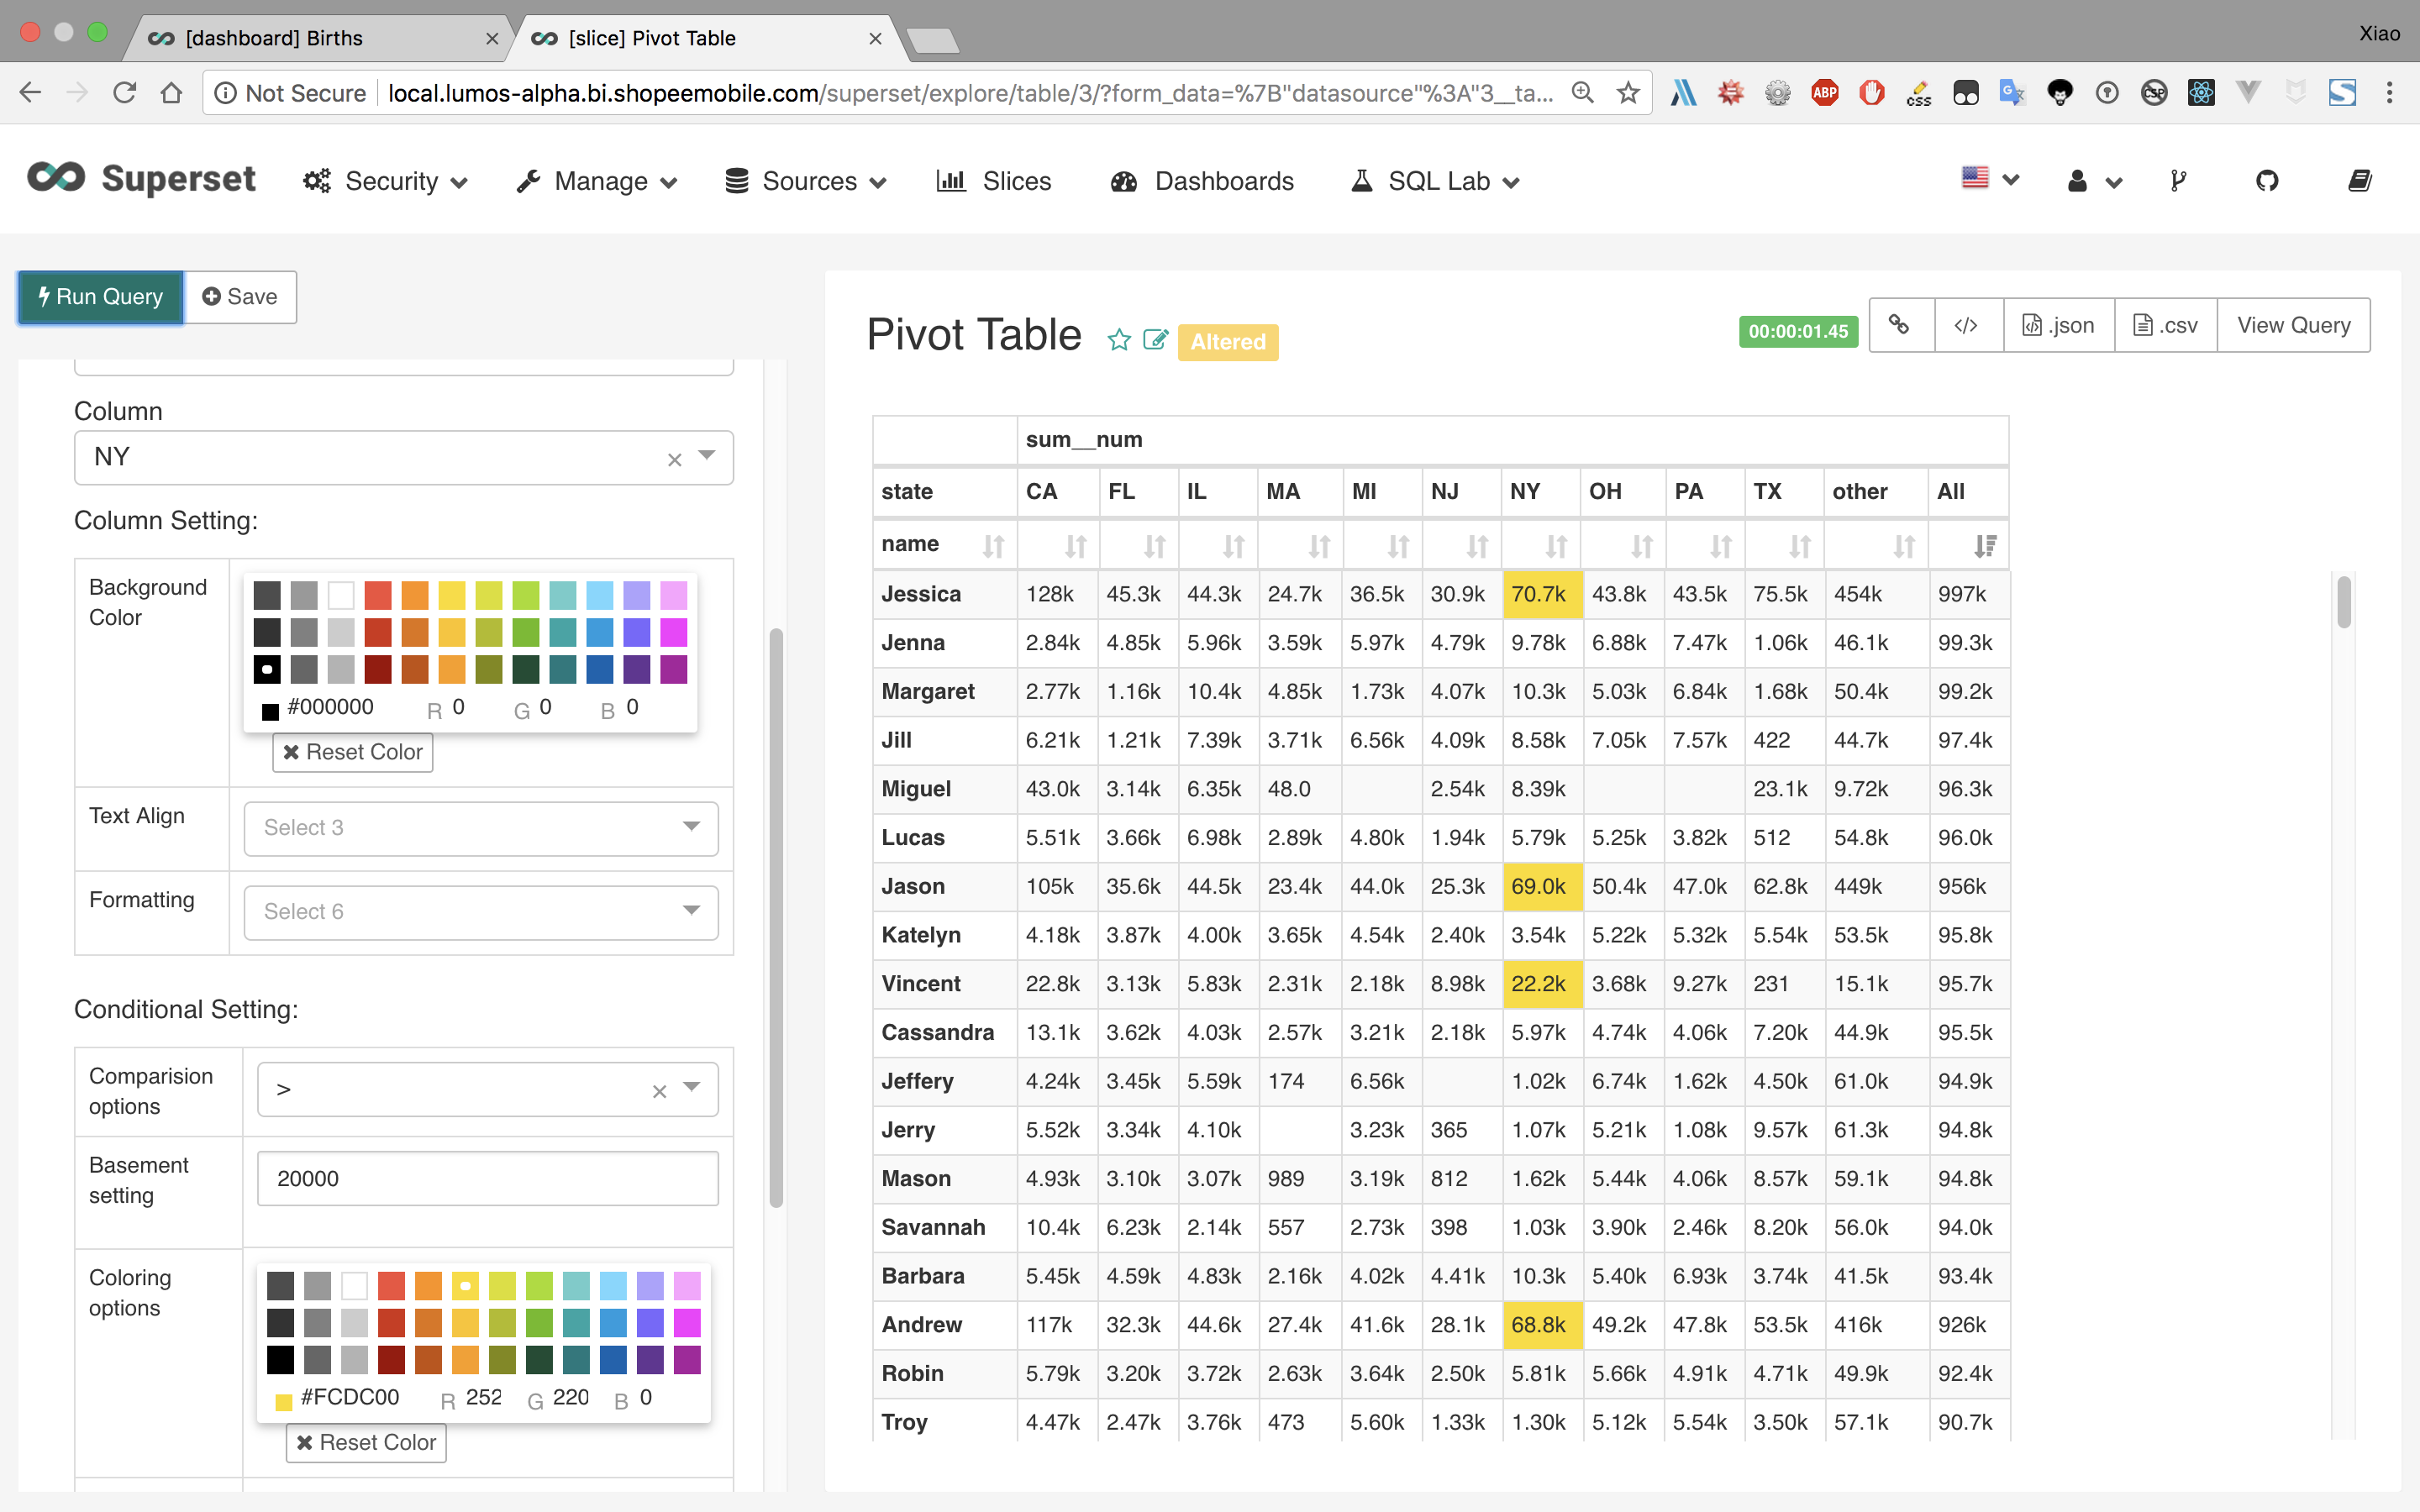
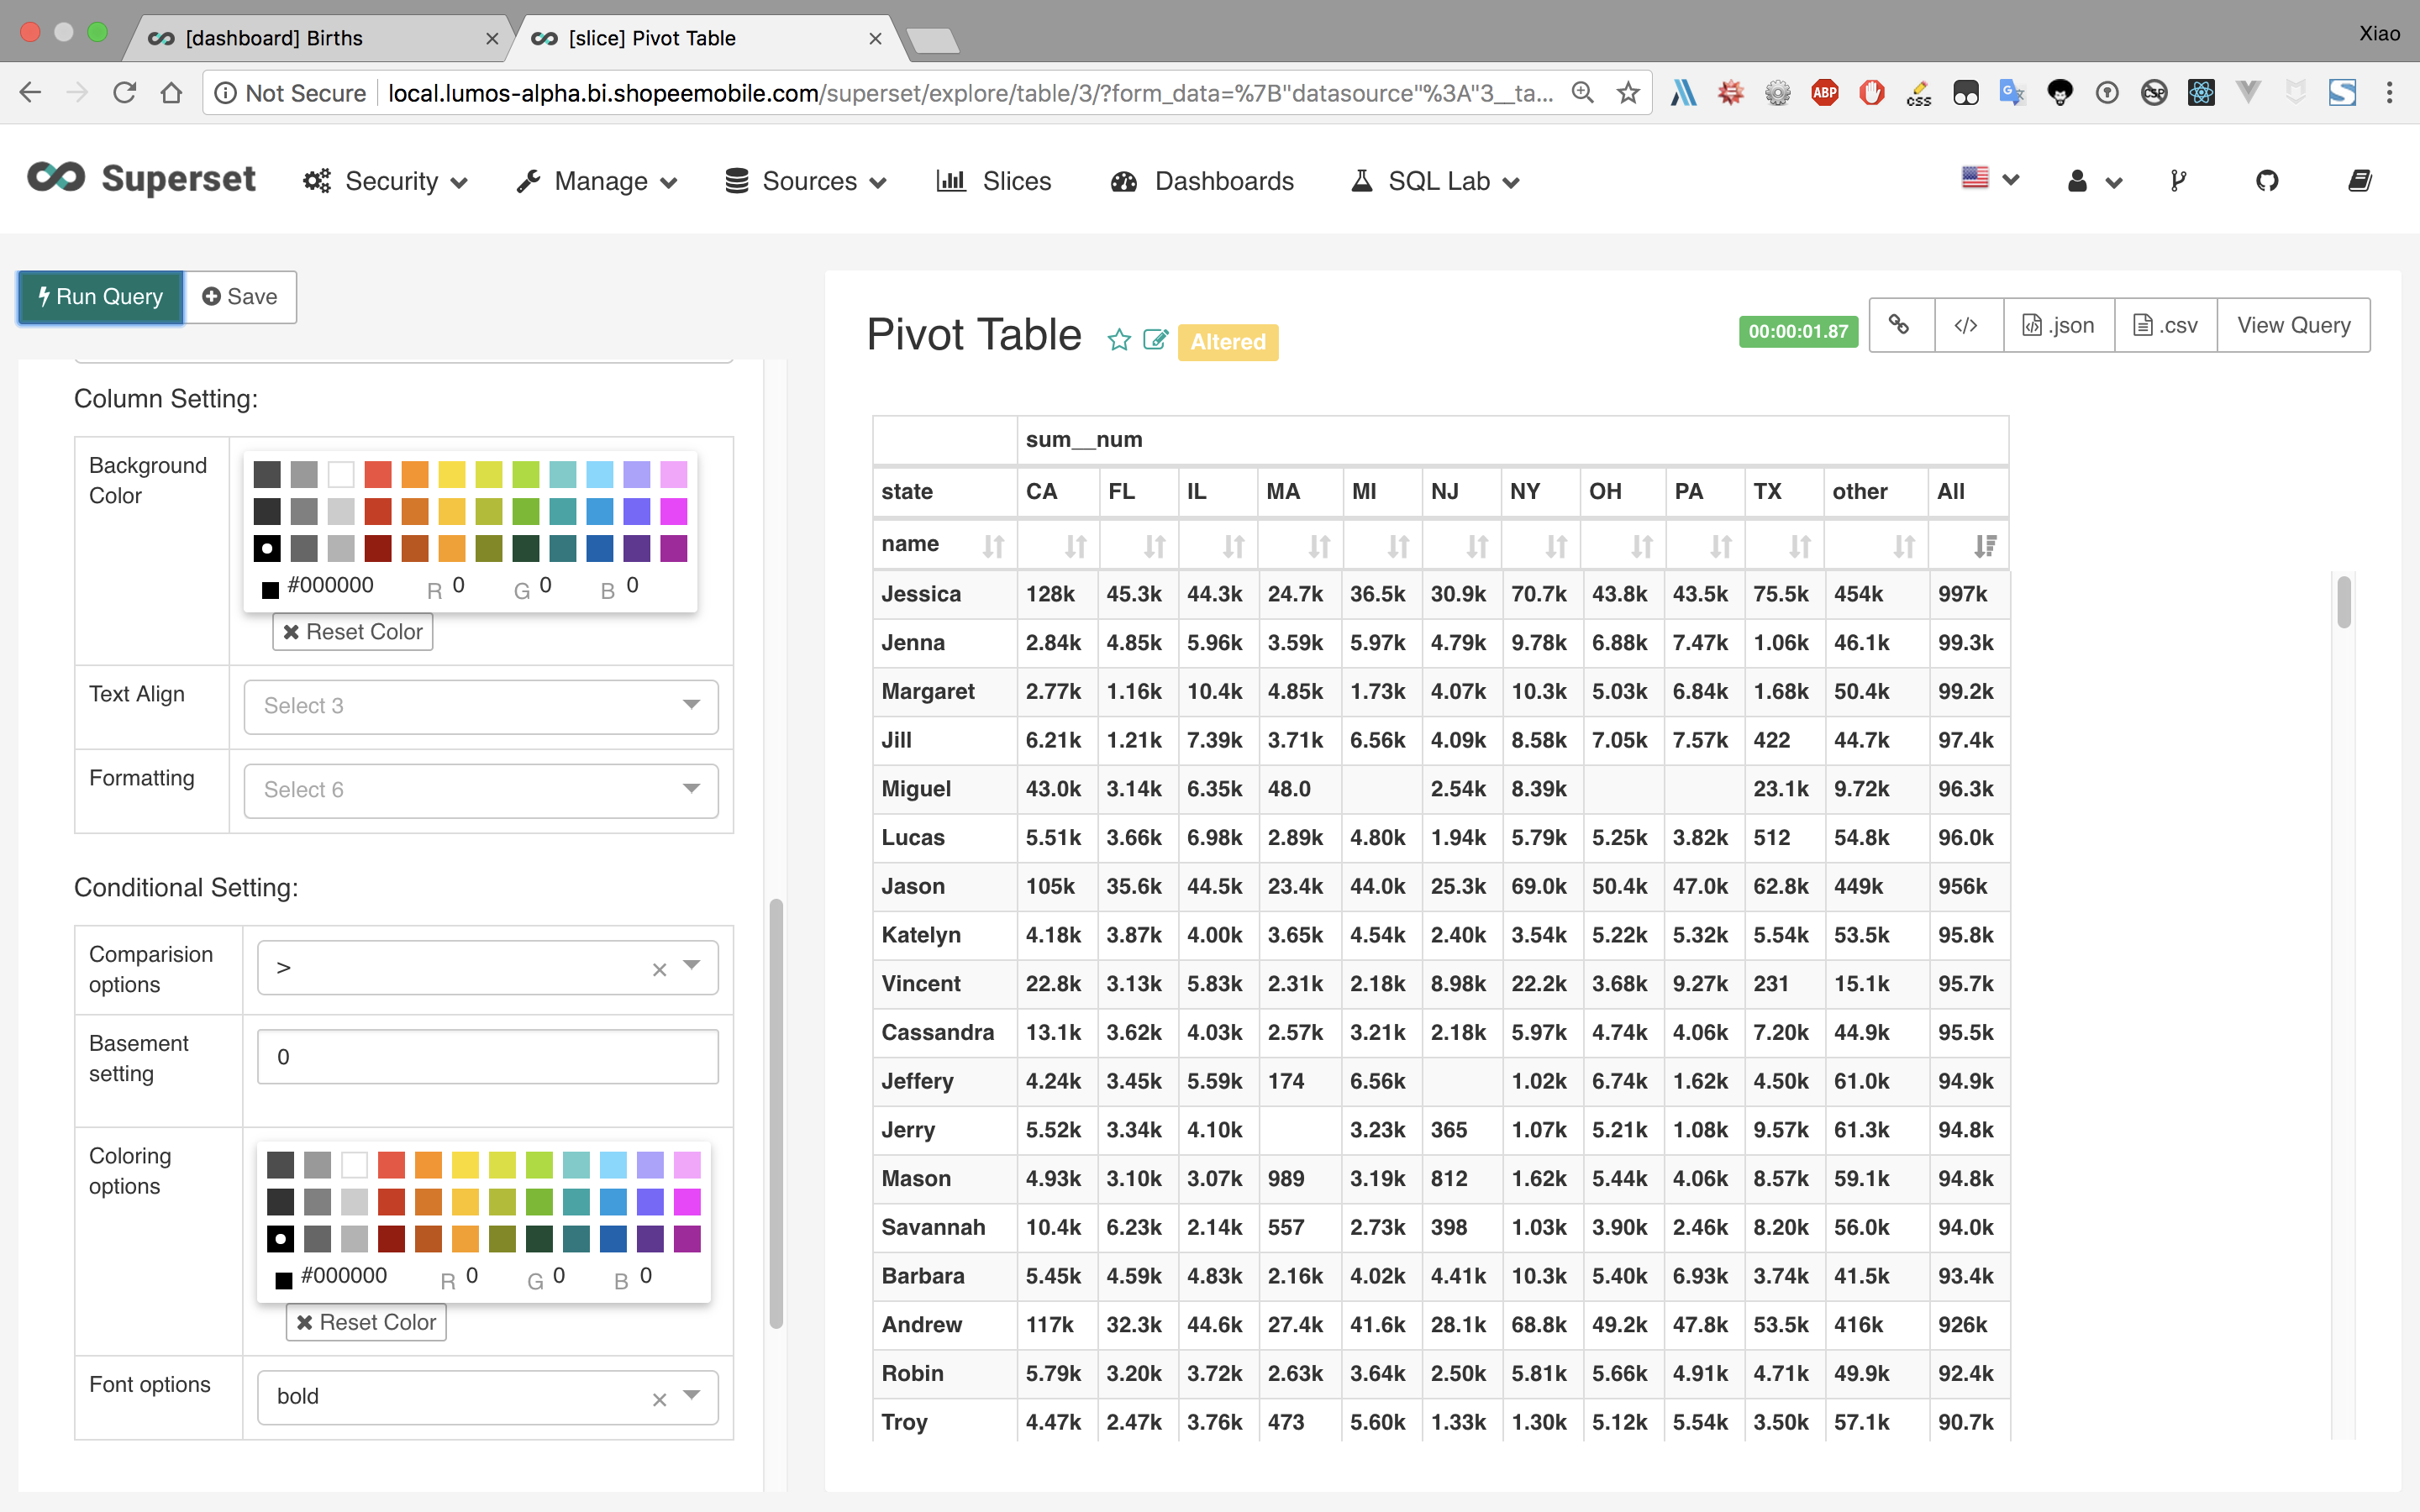
Column configuration:
- User can set general configuration and conditional configuration
  for every column, not just metric.
- The configuration includes color configuration, font weight
  configuration and format configuration.
- Add the ColumnControl for user to set the column configuration.
- Add the action `SET_FETCH_COLUMNS` for ColumnControl to get the
  newest columns rendered in the chart.
- Add the process logic in the pivot table for different situation
  in column configuration.
- Add the ColumnControl_spec to test functions in the ColumnControl.

Row configuration:
- User can set color and font weight for rows containing certain cell.
- Add the RowControl for user to set the row configuration.
- Add the process logic in the pivot table for different situation
  in row configuration.
- Add the RowControl_spec to test functions in the RowControl.

Priority of column config and row config:
- User can set priority themselves.
- Add the checkbox for user to set the priority.
- By default, the column configution has high priority than row
  configuration.
546a572 to
66408ad
Compare
|
Ref issues: |
|
Oh neat! Can we get a few screenshots to get an idea of how this looks? |
|
Here's a gif: https://user-images.githubusercontent.com/1164623/35914802-9a8c8442-0c3f-11e8-8806-6639c5a1b77d.gif I'll update a few more pics today. |
|
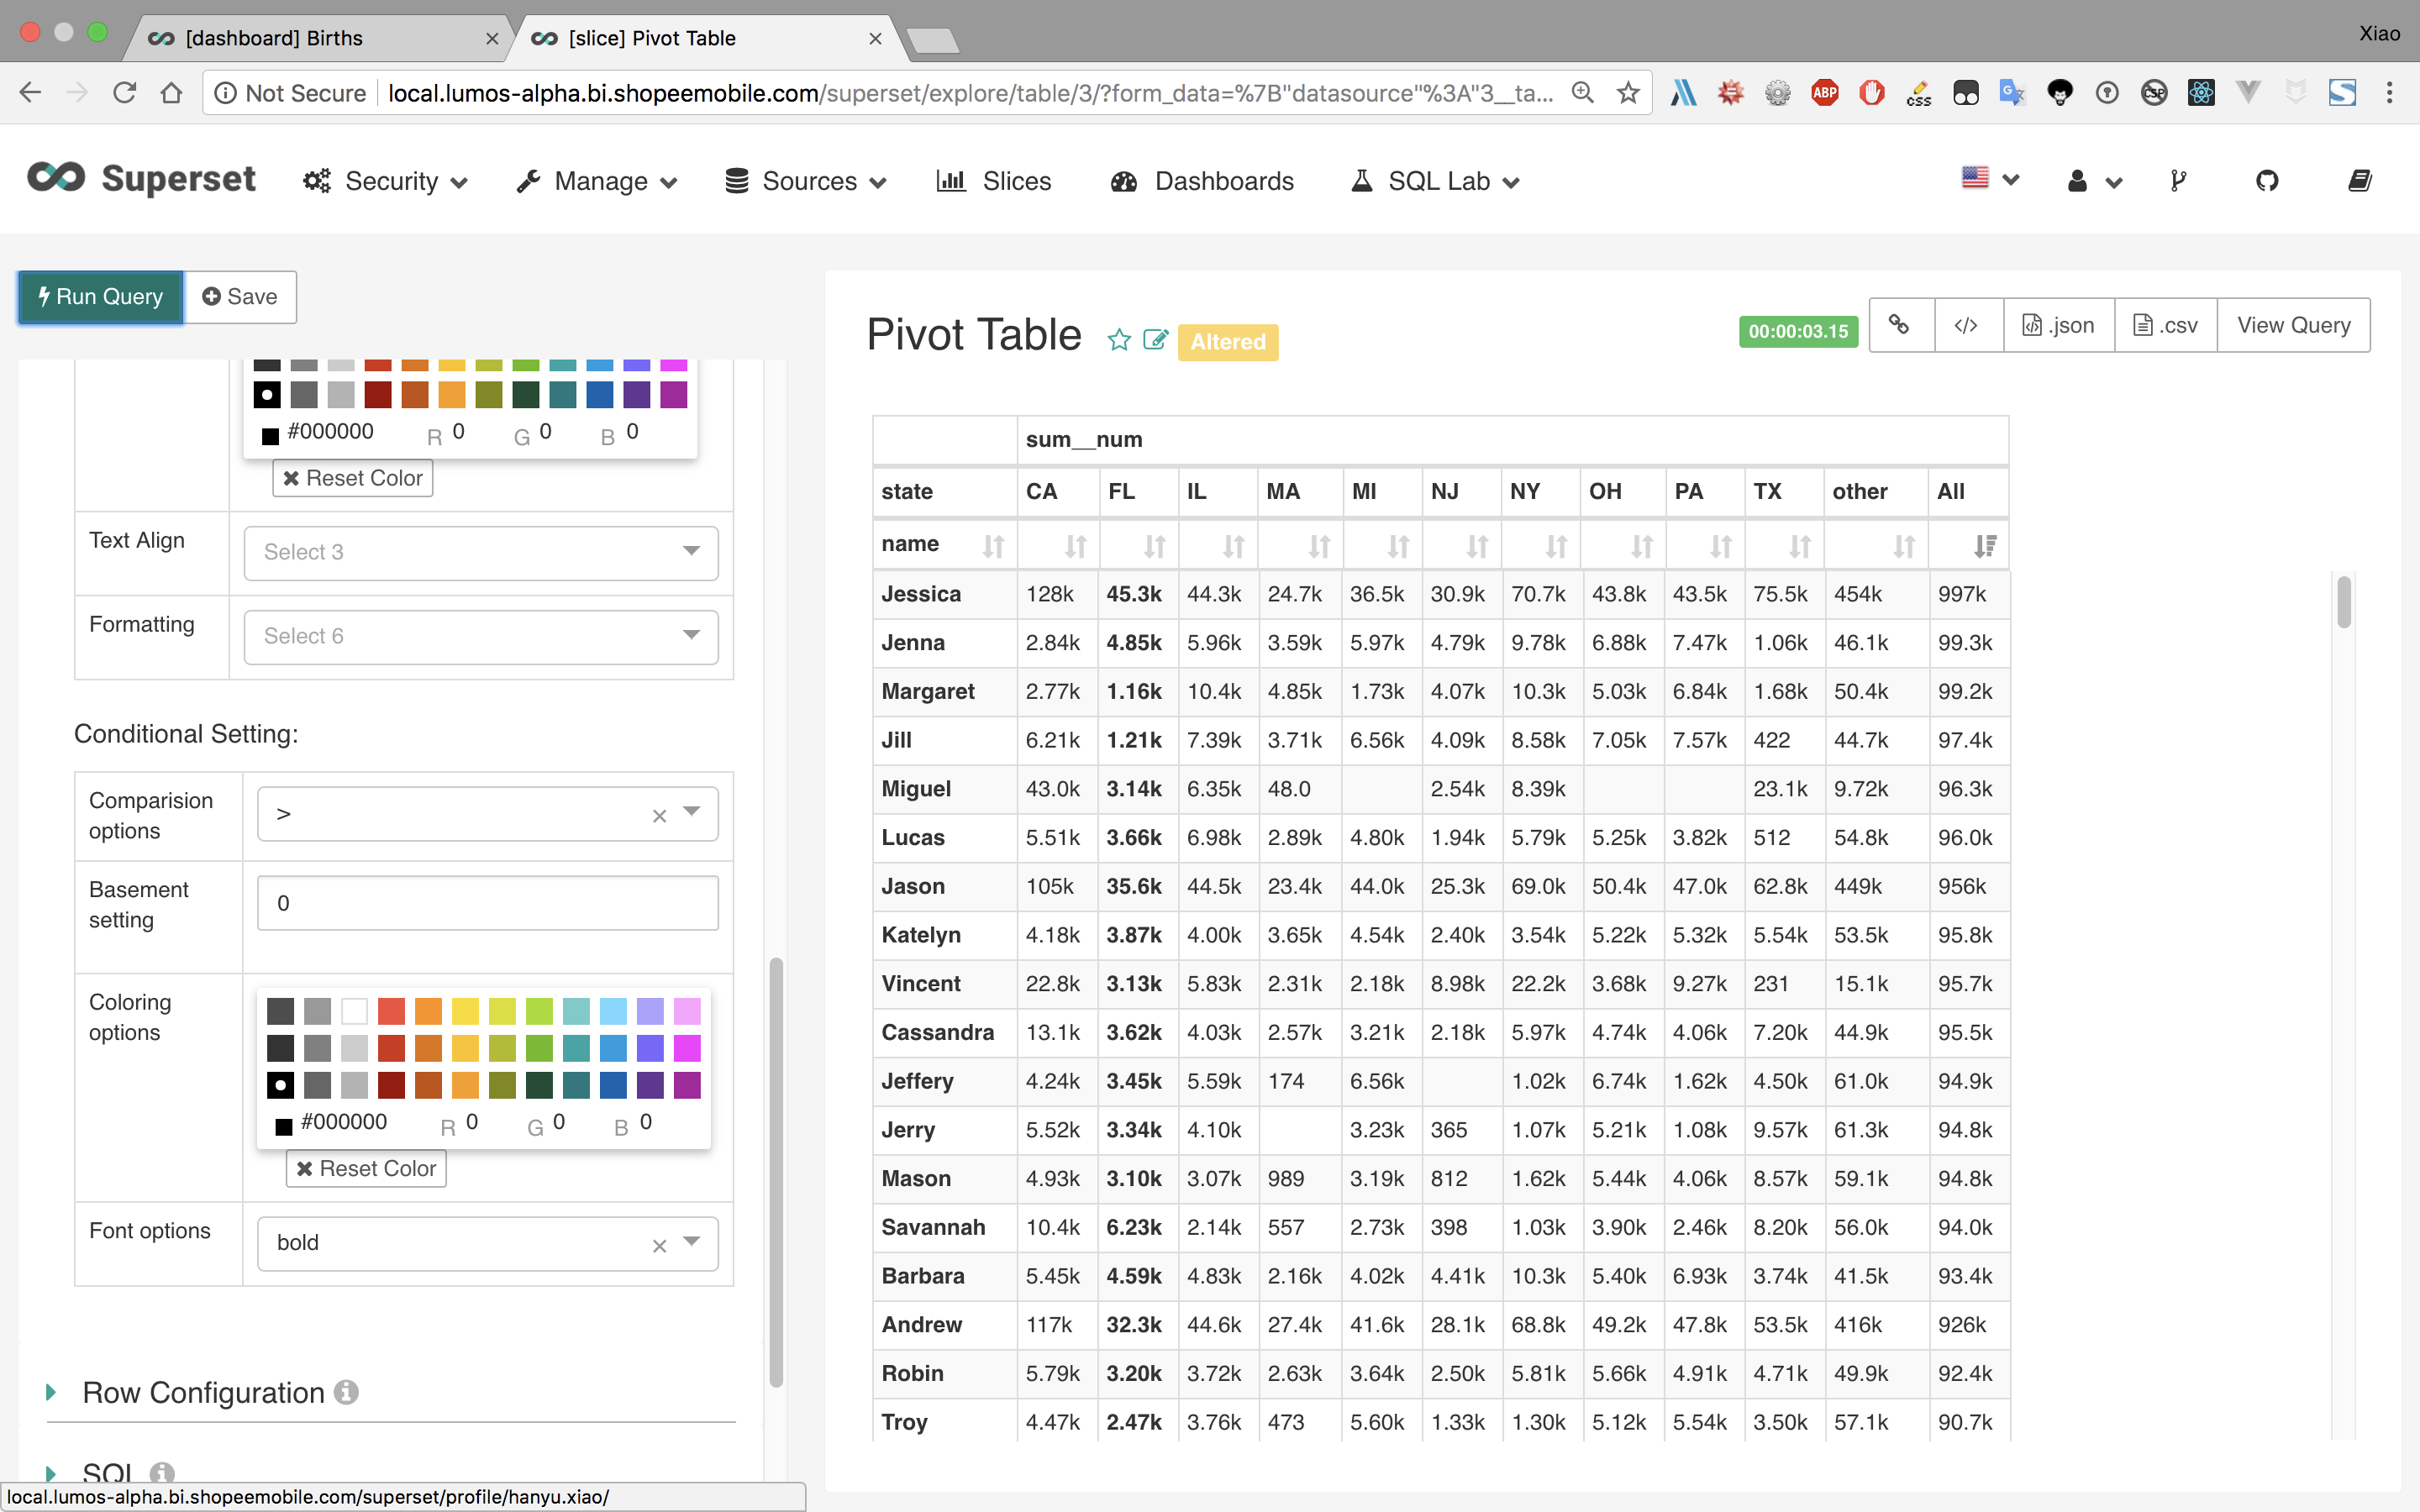
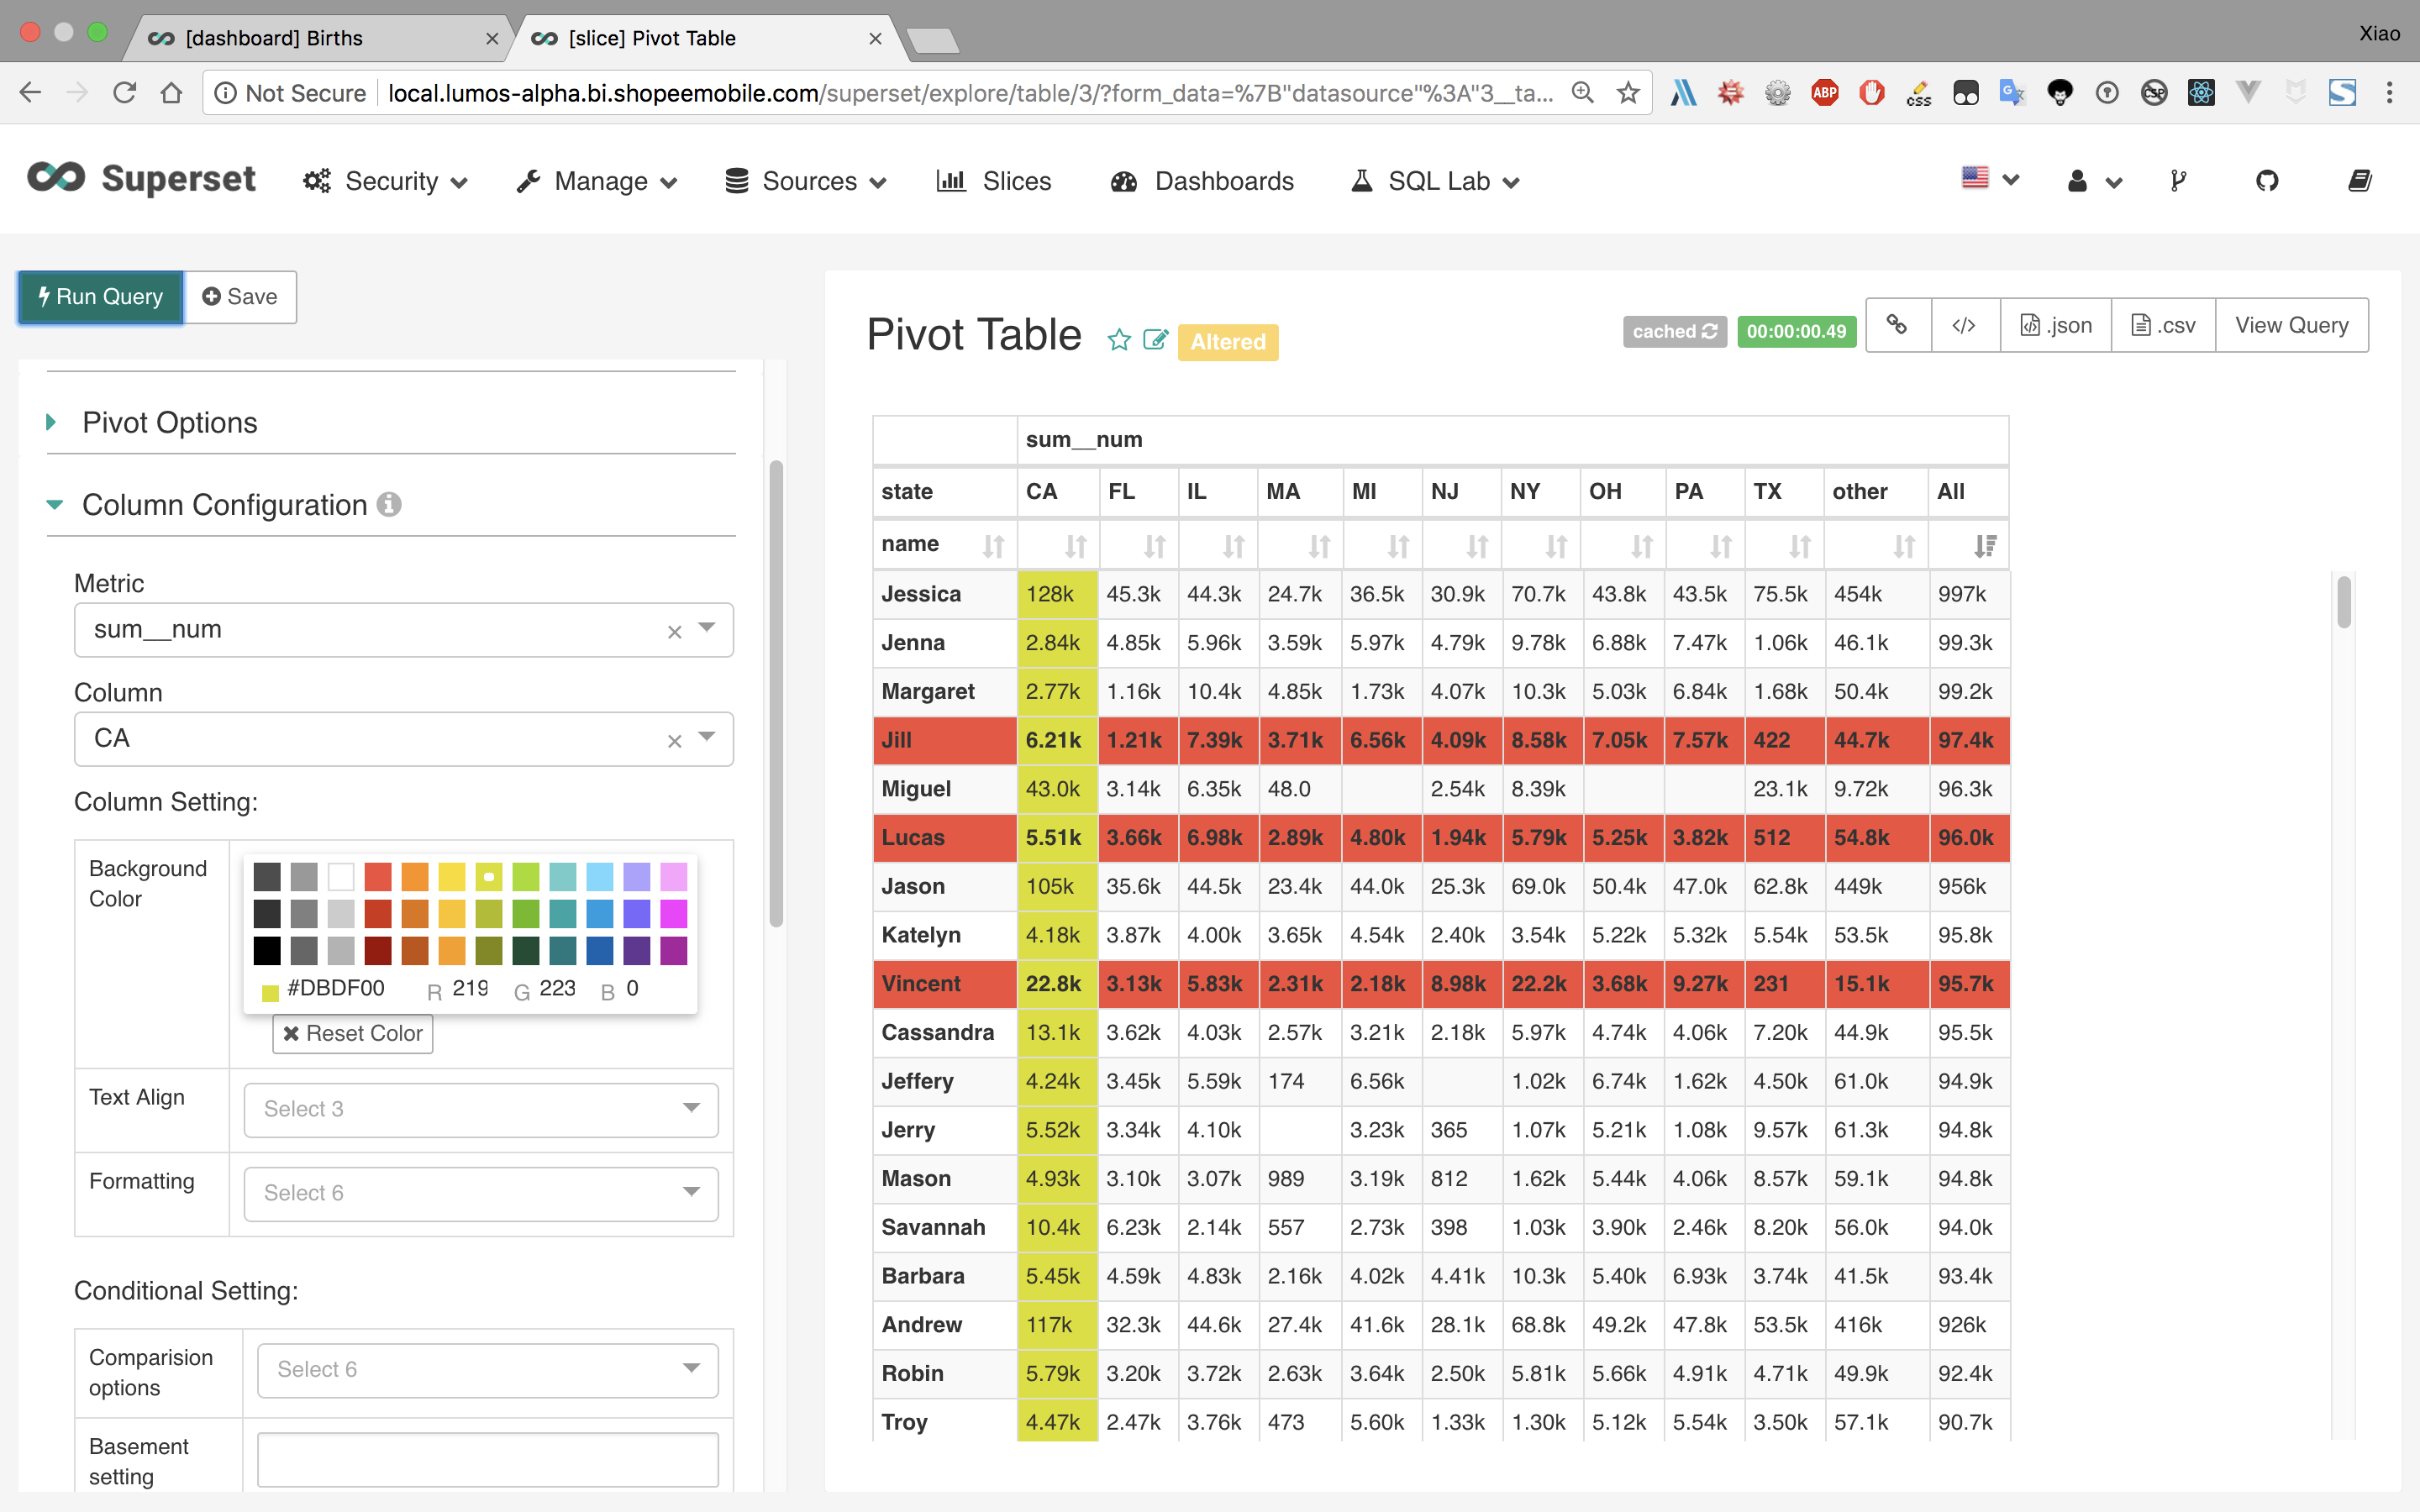
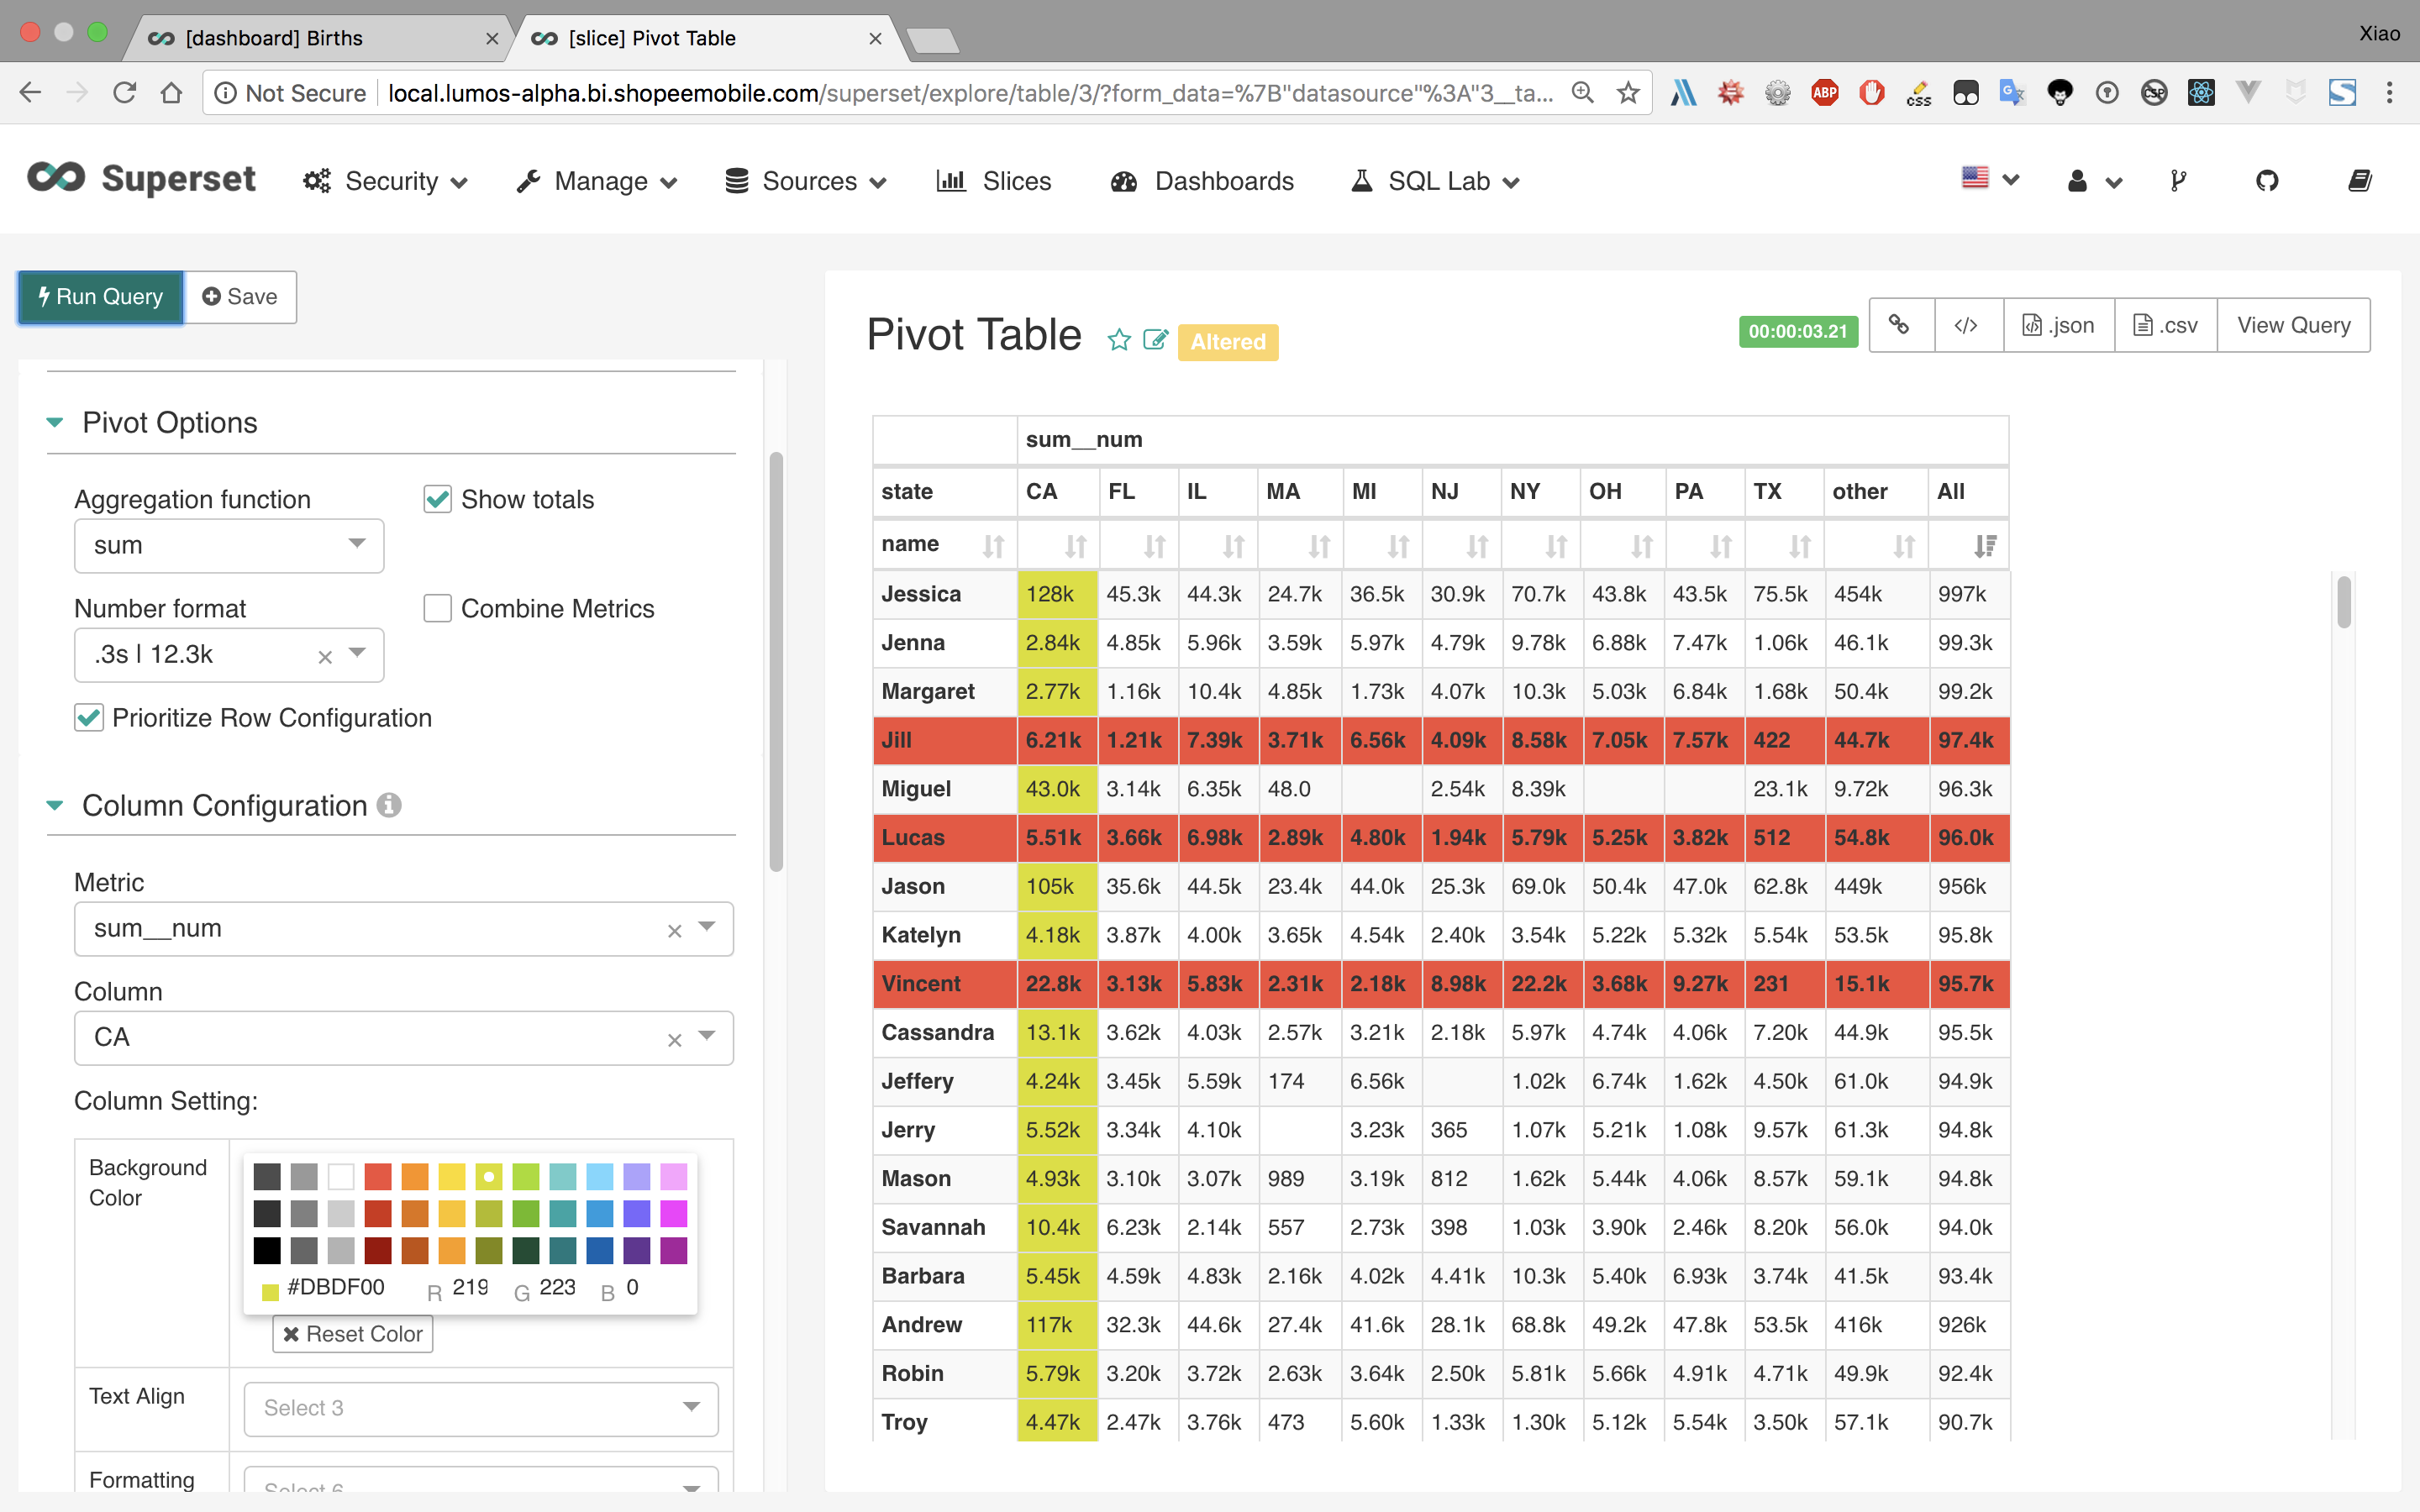
Some test cases column configuration:
column configuration with conditional formatting
|
|
Hi, @mistercrunch Above is the overall features of this so-called "column and row configuration". Actually, we have used superset for almost one year, and designed this feature from bottom up, improve piece by piece, and finally proposed this patch for community. The basic design is:
There're maybe some issues though:
We're definitely sure that there should be some improvements over the UI/UX design, to make it more intuitive, so we propose this to community asking some feedback. And we think that this is a good starting point. This feature is mainly designed for dashboard readers, they may be leaders of the team, just glance over multiple dashboard in minutes, and they need colors to mark the most important metrics in a table for them. That's all, thanks. |
| @@ -584,8 +584,12 @@ def get_data(self, df): | |||
| # Display metrics side by side with each column | |||
| if self.form_data.get('combine_metric'): | |||
| df = df.stack(0).unstack() | |||
| parsed_columns = list(map( | |||
There was a problem hiding this comment.
Choose a reason for hiding this comment
The reason will be displayed to describe this comment to others. Learn more.
Not sure if this code is needed / wanted but maps in python are a bit convoluted. What about using list comprehension?
to_list = lambda x: [six.text_type(z) for z in x] if isinstance(x, tuple) else [x]
parsed_columns = [to_list(x) for x in df.columns.values]
There was a problem hiding this comment.
Choose a reason for hiding this comment
The reason will be displayed to describe this comment to others. Learn more.
Yeah, OK for us. Guido don't like map/reduce/filter, LOL.
|
@xiaohanyu We had a PR to convert all charting request method from GET to POST here: |
|
Haven't dug deep in this PR yet, but it looks like colors are quite binary, as opposed to a spectrum. Seems like many may want more of a gradient to visualize their data more like a heatmap. ? |
|
@graceguo-supercat will definitely rebase the code. |
|
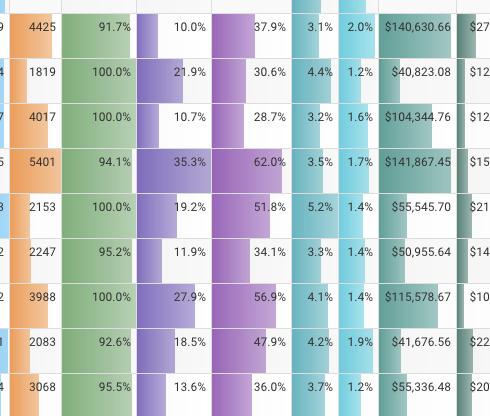
@mistercrunch Yes, we only provide binary colors in this PR. However, we've already implemented a new internal feature that provides some gradient options by length or by color change, here're some screenshots: a new table progress bar settings sectiongradient by length:gradient by color scaleWe think this kind of feature should be proposed as a new feature, and we still need some time to rebase own internal patch. |
|
Oh that looks neat! |
|
Hi All, Has this PR already been pushed?? Ifso in what build would this be? |
|
@michellethomas do you think this conflicts with your goal of deprecating |
|
Hi xiaohanyu, This PR looks beautiful and great, and is what we just need. Appreciated your work! Which superset version will this PR go to? Regards |
|
@CasperLiu Hi, we worked this PR on superset 0.22.1 version, so I think you can cherry pick this PR if you like it. As you can see, the official superset decides to switch http request method from Besides, my team are busy again these days, so we don't have additional time to rebase this PR, sorry... |
|
@xiaohanyu Hi , Like the new PR. Any ETA when and what Superset release will have it ? thanks and good work . - Paul |
|
When will we expect this feature in superset? |
|
Any update on this. Can someone implement this in new version . |
|
is it work for 0.28 version |
|
I'm very interested in this feature as well - any news? |
|
I'd recommend making this a plugin. |
|
Hello! I'm very intrested in this feature. When it will be released? |
|
Please resubmit as plugin! |
|
@mistercrunch @xiaohanyu Hii I have to firstly ask that the row-configuration feature has been removed from superset-2.0.0 ?. |











Column configuration:
for every column, not just metric.
configuration and format configuration.
SET_FETCH_COLUMNSfor ColumnControl to get thenewest columns rendered in the chart.
in column configuration.
Row configuration:
in row configuration.
Priority of column config and row config:
configuration.