 |
 |
|---|
Policy obtained by ppo_cartpole.py with the Proximal Policy Optimization algorithm implemented in PPO.py
 |
 |
|---|
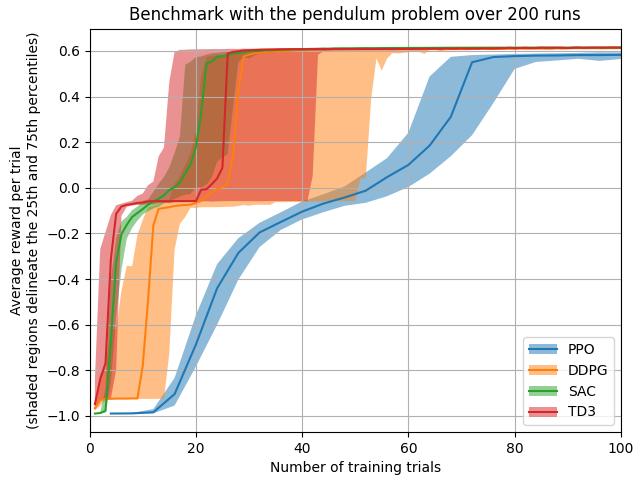
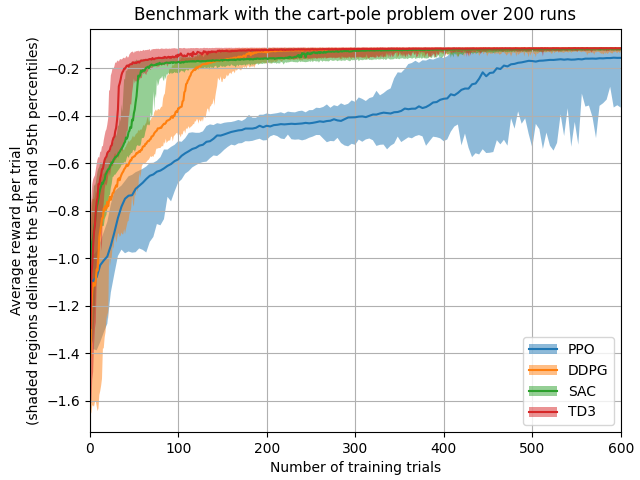
Benchmarks of my reinforcement learning algorithm implementations (code in the branch benchmarks)
- looptools.py: Tools to monitor, extract data and have control during algorithm progress loops. It contains:
- A context manager which allows the SIGINT signal to be processed asynchronously.
- A container-like class to plot variables incrementally on a persistent figure.
- An iterable class to extract numerical data from a file.
- neural_networks.py: Implementation of scalable Multilayer Perceptron (MLP) and Radial Basis Function network (RBF) using only NumPy.
- sumtree_sampler.py: A sum tree structure to efficiently sample items according to their relative priorities.
- pendulum.py: A simple pendulum to be controlled by a torque at its hinge.
- cartpole.py: A free pendulum mounted on a cart which can be controlled either via its lateral speed by means of an embedded feedback controller or by the lateral force applied to it.
- CACLA_pendulum.py: Implementation of the Continuous Actor-Critic Learning Automaton (CACLA) [1] to swing up a pendulum using only NumPy.
- Deep Deterministic Policy Gradient (DDPG):
- DDPG_vanilla.py: Implementation of the Deep Deterministic Policy Gradient algorithm [2] using TensorFlow 1.
- DDPG_PER.py: Implementation of the Deep Deterministic Policy Gradient algorithm [2] using TensorFlow 1 and enhanced with Prioritized Experience Replay (PER) [3].
- ddpg_pendulum.py: Training example of the DDPG algorithm to swing up the pendulum.
- ddpg_cartpole.py: Training example of the DDPG algorithm to swing up the cart-pole.
- Proximal Policy Optimization (PPO):
- PPO.py: Multithreaded implementation of the Proximal Policy Optimization algorithm [4] using TensorFlow 1.
- ppo_pendulum.py: Training example of the PPO algorithm to swing up the pendulum using multithreaded workers.
- ppo_cartpole.py: Training example of the PPO algorithm to swing up the cart-pole using workers running in the main thread.
- Twin Delayed Deep Deterministic policy gradient (TD3):
- TD3.py: Implementation of the Twin Delayed Deep Deterministic policy gradient algorithm [5] using TensorFlow 2.
- td3_pendulum.py: Training example of the TD3 algorithm to swing up the pendulum.
- td3_cartpole.py: Training example of the TD3 algorithm to swing up the cart-pole.
- Soft Actor-Critic (SAC):
- SAC.py: Implementation of the Soft Actor-Critic algorithm with automated entropy temperature adjustment [6] using TensorFlow 2.
- sac_pendulum.py: Training example of the SAC algorithm to swing up the pendulum.
- sac_cartpole.py: Training example of the SAC algorithm to swing up the cart-pole.
- Deep learning:
- cnn_single_target.py: Deep neural network that detects and gives the coordinates and size of the biggest desired object in a picture.
- cnn_multi_targets.py: Deep convolutional network that detects and gives the coordinates and size of all the occurrences of a desired object in a picture.
- tf_cpp_binding: Contains a C++ template class that provides a binding to TensorFlow native C API in order to easily import and use trained models.
- LQR.py: Linear-Quadratic Regulators for finite or infinite horizons and continuous or discrete times.
- lm_slsqp_cartpole.py: Automated control synthesis to swing up a cart-pole for which the physical parameters are unknown. The parameter identification is performed by a non-linear regression, the trajectory planning is based on a direct collocation method using non-linear programming and the trajectory tracking is ensured by LQR control.
- quadratures.py: Contains a class providing Gauss-Lobatto quadratures and barycentric Lagrange interpolation.
[1] Van Hasselt, Hado, and Marco A. Wiering. "Reinforcement learning in continuous action spaces."
2007 IEEE International Symposium on Approximate Dynamic Programming and Reinforcement Learning. IEEE, 2007.
[2] Lillicrap, Timothy P., et al. "Continuous control with deep reinforcement learning." arXiv preprint arXiv:1509.02971 (2015).
[3] Schaul, Tom, et al. "Prioritized experience replay." arXiv preprint arXiv:1511.05952 (2015).
[4] Schulman, John, et al. "Proximal policy optimization algorithms." arXiv preprint arXiv:1707.06347 (2017).
[5] Fujimoto, Scott, Herke Van Hoof, and David Meger. "Addressing function approximation error in actor-critic methods." arXiv preprint arXiv:1802.09477 (2018).
[6] Haarnoja, Tuomas, et al. "Soft actor-critic algorithms and applications." arXiv preprint arXiv:1812.05905 (2018).
All you will need are the following packages:
$ pip install scipy matplotlib tensorflow tensorflow_probability tqdm PyYAML
To install the module for the current user, run in a terminal:
$ pip install . --user
For example, to monitor the progress of a running algorithm by plotting the evolution of two variables reward and loss, using a logarithmic scale for the second one, you can do:
from looptools import Loop_handler, Monitor

monitor = Monitor( [ 1, 1 ], titles=[ 'Reward', 'Loss' ], log=2 )

with Loop_handler() as interruption :
	for i in range( 1000 ) :

		(long computation of the next reward and loss)

		monitor.add_data( reward, loss )

		if interruption() :
			break

(clean completion of the algorithm, backup of the data...)
The Loop_handler context manager allows you to stop the iterations with Ctrl+C in a nice way so that the script can carry on after the loop.
The Monitor works as a container, so it accepts indexing in order to:
- Modify plotted values:
monitor[:100] = 0(set the first 100 data points to a same value)
monitor[:100] = range( 100 )(set the first 100 values with an iterable) - Remove data points from the graph:
del monitor[:100](remove the 100 first values) - Crop the plotted data:
monitor( *monitor[100:] )(keep only the 100 latest data points)
Which is equivalent to:
data = monitor[100:]
monitor.clear()
monitor.add_data( *data )
Let's say that you have a file data.txt storing the data like this:
Data recorded at 20:57:08 GMT the 25 Aug. 91
time: 0.05 alpha: +0.54 beta: +0.84 gamma: +1.55
time: 0.10 alpha: -0.41 beta: +0.90 gamma: -2.18
time: 0.15 alpha: -0.98 beta: +0.14 gamma: -0.14
time: 0.20 alpha: -0.65 beta: -0.75 gamma: +1.15
...
To extract the time and the variables alpha, beta and gamma, you can either:
- Let
Datafileidentify the columns with numerical values while filtering if necessary the relevant lines with a regex or the number of expected columns:
datafile = Datafile( 'data.txt', filter='^time:' )or
datafile = Datafile( 'data.txt', ncols=8 ) - Specify the columns where to look for the data with a list:
datafile = Datafile( 'data.txt', [ 2, 4, 6, 8 ] ) - Specify the columns with an iterable or a list of iterables:
datafile = Datafile( 'data.txt', range( 2, 9, 2 ) ) - Specify the columns with a string that will be processed by the function
strange()provided by this module as well:
datafile = Datafile( 'data.txt', '2:8:2' )
If the file stores the data in CSV, you have to specify that the column separator is a comma with the argument sep=','.
Therefore, to plot the data straight from the file, you can do:
from looptools import Datafile, Monitor

datafile = Datafile( 'data.txt', [ 2, 4, 6, 8 ] )
all_the_data = datafile.get_data()

# Plot for example the two variables alpha and beta on a same graph and
# the third variable gamma on a second graph below using a dashed line:
monitor = Monitor( [ 2, 1 ],
                   titles=[ 'First graph', 'Second graph' ],
                   labels=[ '$\\alpha$', '$\\beta$', '$\gamma$' ],
                   plot_kwargs={3: {'ls':'--'}} )
monitor.add_data( *all_the_data )
Or if you want to iterate over the rows:
for time, alpha, beta, gamma in datafile :
	monitor.add_data( time, alpha, beta, gamma )
If you want to create a pandas DataFrame from these data, you may need to transpose the representation of rows and columns by using the method get_data_by_rows:
import pandas as pd

df = pd.DataFrame( datafile.get_data_by_rows(), columns=[ 'time', 'alpha', 'beta', 'gamma' ] )
For further information, please refer to the docstrings in looptools.py.