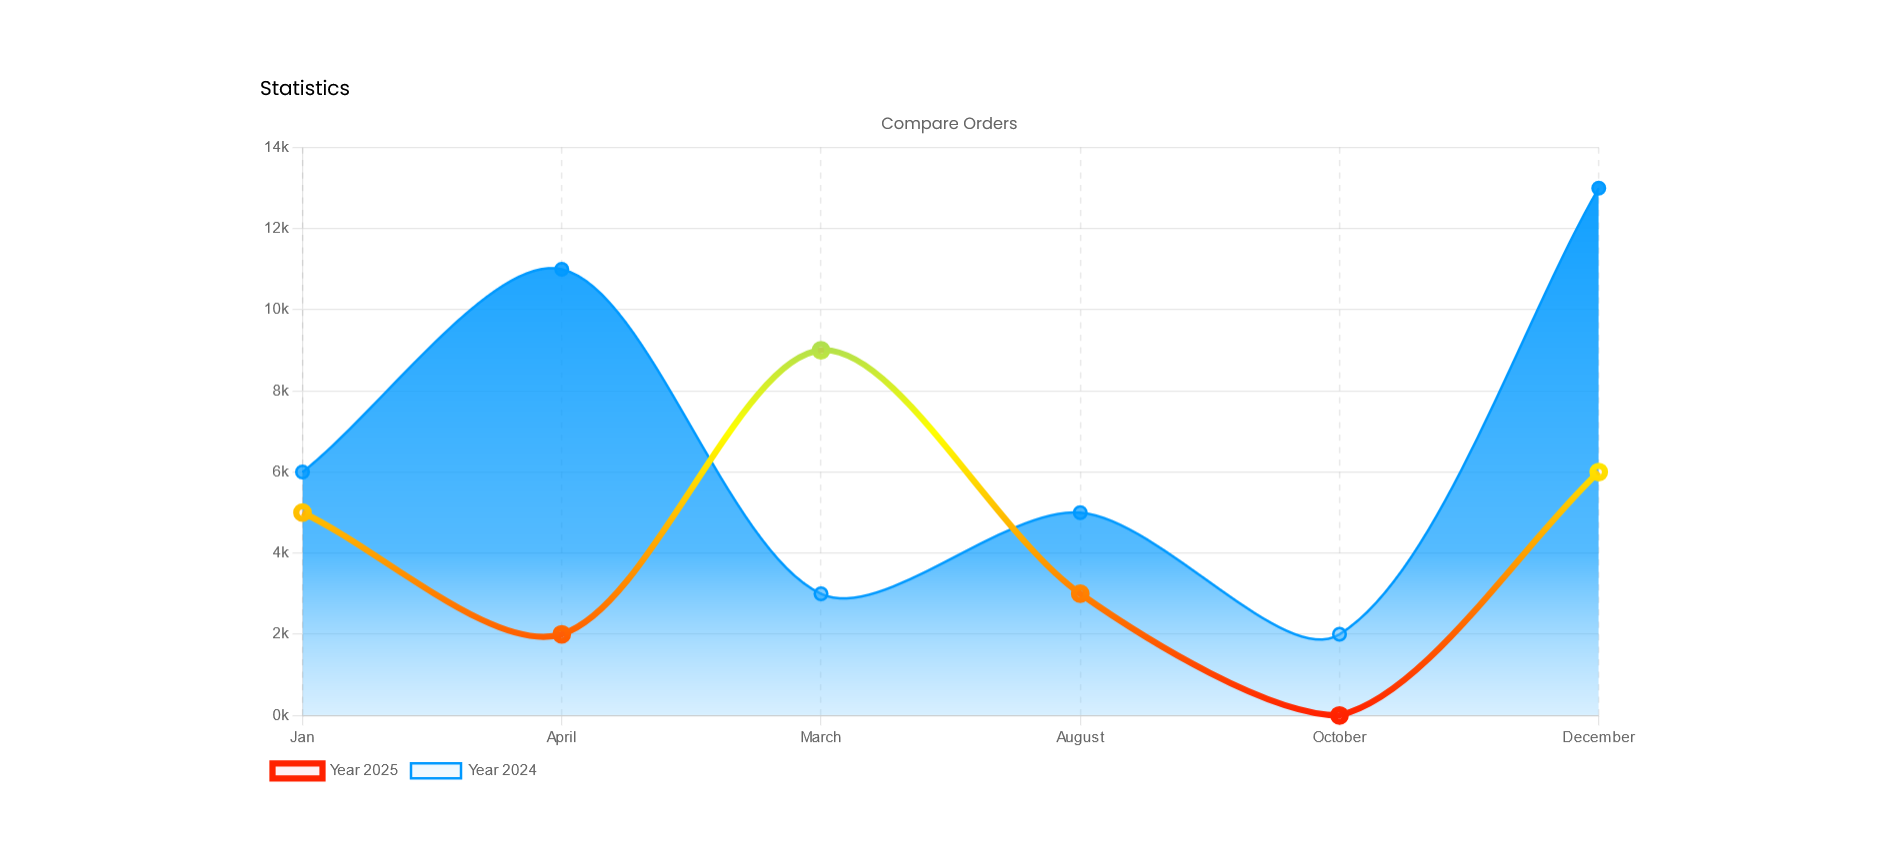
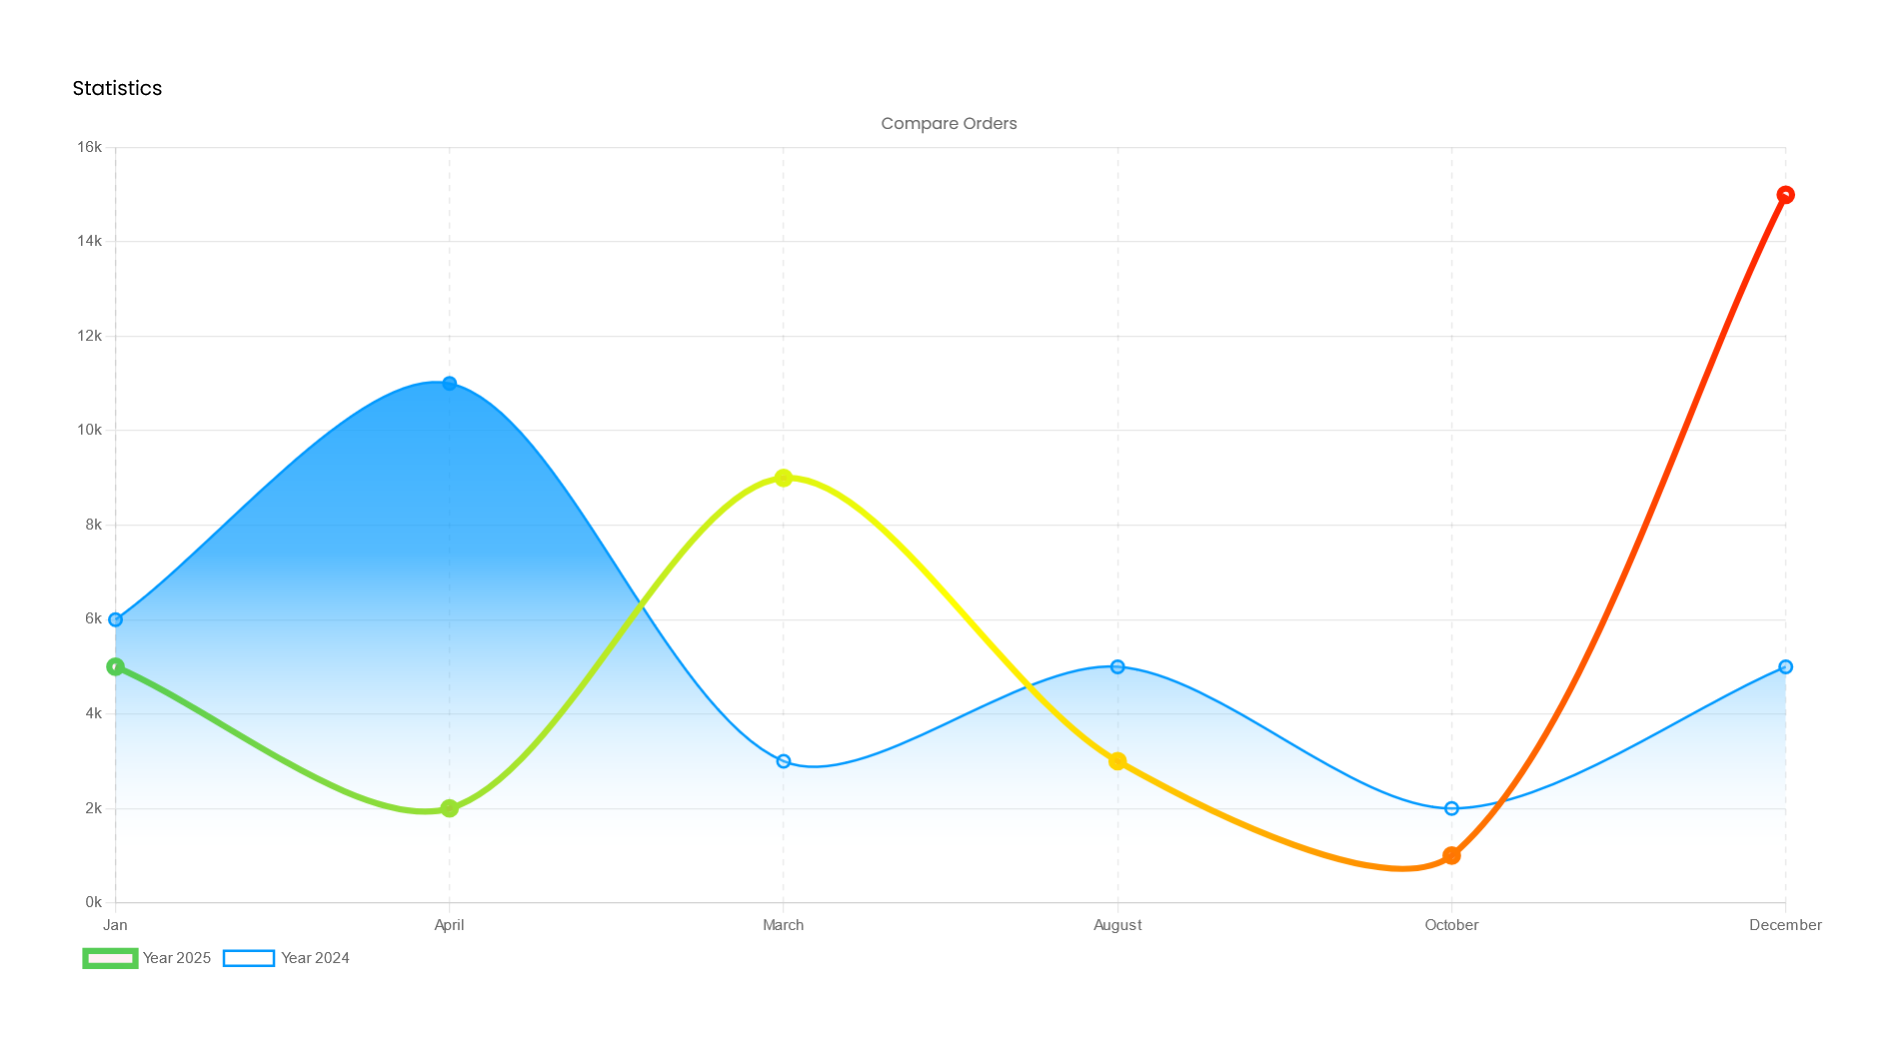
Chart.js line chart example with gradients and animations.
<!DOCTYPE html>
<html lang="en">
<head>
<meta charset="UTF-8">
<meta name="viewport" content="width=device-width, initial-scale=1.0">
<title>Date Time Chart</title>
<script src="https://cdn.jsdelivr.net/npm/chart.js"></script>
<script src="https://cdn.jsdelivr.net/npm/chartjs-adapter-date-fns/dist/chartjs-adapter-date-fns.bundle.min.js"></script>
<script>
let width, height, gradient;
function getGradient(ctx, chartArea) {
const chartWidth = chartArea.right - chartArea.left;
const chartHeight = chartArea.bottom - chartArea.top;
if (!gradient || width !== chartWidth || height !== chartHeight) {
// Create the gradient because this is either the first render
// or the size of the chart has changed
width = chartWidth;
height = chartHeight;
// Vertically
gradient = ctx.createLinearGradient(0, chartArea.bottom, 0, chartArea.top);
// Horizontally
gradient = ctx.createLinearGradient(chartArea.right, chartArea.top, chartArea.left, chartArea.top);
// Colors
gradient.addColorStop(0, '#f20')
gradient.addColorStop(0.5, '#ff0')
gradient.addColorStop(1, '#5c5')
}
return gradient;
}
function createDiagonalPattern(color = 'black') {
let shape = document.createElement('canvas')
shape.width = 10
shape.height = 10
let c = shape.getContext('2d')
c.strokeStyle = color
c.beginPath()
c.moveTo(2, 0)
c.lineTo(10, 8)
c.stroke()
c.beginPath()
c.moveTo(0, 8)
c.lineTo(2, 10)
c.stroke()
return c.createPattern(shape, 'repeat')
}
window.onload = () => {
// const labels = Utils.months({ count: DATA_COUNT });
const ctx = document.getElementById('myChart');
// Create a Gradient
const cnv = ctx.getContext('2d');
var gradient1 = cnv.createLinearGradient(0, 0, 0, 600);
gradient1.addColorStop(0, '#0099ff')
gradient1.addColorStop(0.6, '#0099ffaa')
gradient1.addColorStop(1, '#fff1')
const chart = new Chart(ctx, {
type: 'line',
data: {
datasets: [{
label: 'Year 2024',
data: [{
x: '2024-11-05 00:25:30',
y: 50
}, {
x: '2024-11-06 01:00:28',
y: 60
}, {
x: '2024-11-07 09:00:28',
y: 20
}, {
x: '2024-11-08 11:00:28',
y: 22
}],
tension: 0.3,
borderWidth: 5,
borderColor: function (context) {
const chart = context.chart;
const { ctx, chartArea } = chart;
if (!chartArea) {
// This case happens on initial chart load
return;
}
return getGradient(ctx, chartArea);
},
backgroundColor: '#f251',
pointStyle: 'circle',
pointRadius: 5,
pointHoverRadius: 10,
fill: false,
animations: {
radius: {
duration: 400,
easing: 'linear',
loop: (context) => context.active
}
},
hoverRadius: 12,
hoverBackgroundColor: '#f25',
interaction: {
mode: 'nearest',
intersect: false,
axis: 'x'
},
},
{
label: 'Year 2025',
data: [{
x: '2024-11-05 00:25:30',
y: 22
}, {
x: '2024-11-06 01:00:28',
y: 49
}, {
x: '2024-11-07 09:00:28',
y: 26
}, {
x: '2024-11-08 11:00:28',
y: 38
}],
tension: 0.3,
borderWidth: 2,
borderColor: '#0099ff',
backgroundColor: '#0099ff11',
pointStyle: 'circle',
pointRadius: 5,
pointHoverRadius: 10,
fill: true,
borderDash: [10, 5], // Dashed line style
backgroundColor: gradient1,
backgroundColor: createDiagonalPattern('#09f'),
parsing: {
// yAxisKey: 'nested.value'
}
}
]
},
options: {
responsive: true,
parsing: {
// Parse data array
// xAxisKey: 'id',
// yAxisKey: 'nested.value',
// key: 'nested.value'
},
scales: {
y: {
beginAtZero: true,
grid: {
// color: '#ccc',
type: 'time',
display: true,
lineWidth: 1,
},
border: {
// dash: [0, 0],
},
ticks: {
// color: '#ccc',
display: true,
lineWidth: 1,
callback: function (value) { return value + 'k'; }
}
},
x: {
type: 'timeseries',
time: {
unit: 'day',
tooltipFormat: 'dd-MM-yyyy HH:mm:ss',
displayFormats: {
hour: 'HH:MM',
day: 'dd-MM-yyyy'
}
},
// min: '2024-11-04 00:00:00',
// max: '2024-11-09 00:00:00',
grid: {
// color: '#ccc',
display: true,
lineWidth: 1,
},
border: {
dash: [5, 5],
},
ticks: {
display: true,
// color: '#ccc',
}
}
},
plugins: {
title: {
display: true,
text: 'Compare Orders',
// text: (ctx) => 'Point Style: ' + ctx.chart.data.datasets[0].pointStyle,
font: {
size: 13,
weight: 'normal',
family: 'Poppins',
},
},
legend: {
display: true,
align: 'start',
position: 'bottom',
}
},
animations: {
radius: {
duration: 400,
easing: 'linear',
loop: (context) => context.active
}
},
hoverRadius: 12,
hoverBackgroundColor: '#0099ff',
interaction: {
mode: 'nearest',
intersect: false,
axis: 'x'
},
onClick: (e) => {
console.log(e);
}
},
});
}
</script>
<style>
@import url('https://fonts.googleapis.com/css2?family=Poppins:ital,wght@0,100;0,200;0,300;0,400;0,500;0,600;0,700;0,800;0,900;1,100;1,200;1,300;1,400;1,500;1,600;1,700;1,800;1,900&display=swap');
body {
padding: 50px 50px;
}
body * {
font-family: Poppins, Arial, Helvetica, sans-serif;
}
</style>
</head>
<body>
<div id="statistics">
<div class="panel-subtitle">Statistics</div>
<canvas id="myChart"></canvas>
</div>
</body>
</html>const img = new Image();
img.src = 'https://example.com/my_image.png';
img.onload = () => {
const ctx = document.getElementById('canvas').getContext('2d');
const fillPattern = ctx.createPattern(img, 'repeat');
const chart = new Chart(ctx, {
data: {
labels: ['Item 1', 'Item 2', 'Item 3'],
datasets: [{
data: [10, 20, 30],
backgroundColor: fillPattern
}]
}
});
};function createDiagonalPattern(color = 'green') {
let shape = document.createElement('canvas')
shape.width = 10
shape.height = 10
let c = shape.getContext('2d')
c.strokeStyle = color
c.beginPath()
c.moveTo(2, 0)
c.lineTo(10, 8)
c.stroke()
c.beginPath()
c.moveTo(0, 8)
c.lineTo(2, 10)
c.stroke()
return c.createPattern(shape, 'repeat')
}
const chart = new Chart(ctx, {
type: 'bar',
data: {
labels: ['Item 1', 'Item 2', 'Item 3'],
datasets: [{
data: [10, 20, 30],
backgroundColor: createDiagonalPattern('#09f'),
fill: true,
tension: 0.3,
borderWidth: 2,
borderColor: '#09f',
backgroundColor: '#09f1',
pointStyle: 'circle',
pointRadius: 5,
pointHoverRadius: 10,
}]
}
});- https://www.chartjs.org/docs/latest
- https://www.chartjs.org/docs/latest/general/data-structures.html
- https://www.chartjs.org/docs/latest/general/colors.html#patterns-and-gradients
- https://www.chartjs3.com/docs/chart/getting-started
- https://www.youtube.com/watch?v=DnjlLbOsPlM
- https://www.youtube.com/watch?v=AEaXyzCElGI
- https://www.youtube.com/watch?v=vmp3czGfw2U
- https://www.youtube.com/watch?v=EVHi41f7psQ