Repository navigation
Support
The following documentation is to assist team members support the solution, specifically during outages.
-
Support Playbook
- Table of Contents
- Architecture
- Support
Media Monitoring & Insights (MMI) is an event-based micro-service architecture that is hosted on Openshift. Kafka provides the event-based messaging and horizontal parallel scaling. Search is provided by Elasticsearch. Keycloak provides the authentication services through government issued IDIR accounts. The backend services are written primarily in .NET. The frontend applications are written in React and Typescript. The solution is containerized using Docker and can be hosted on any container orchestration platform that supports Docker.
There are two types of services through the solution, Producers and Consumers. A Consumer performs an action when it receives a message from Kafka. A Producer initiates actions by sending messages to Kafka.
The solution uses Oauth2.0 for security (authentication and authorization). A user or a service account must obtain a valid access token from Keycloak before making requests for the web applications or the API. Keycloak is a 'custom realm' hosted and managed by the Exchange Lab. MMI has full control over this realm, and is responsible for configuration.
The primary database that contains all content and configuration uses PostgreSQL, and is managed through the CrunchyDB operator hosted in Openshift.
Files such as audio and video are stored on permanently mapped volumes within Openshift and within BC Government S3 buckets.
SignalR is used to handle communication and messaging to the web applications. This is supported through a Kafka backplane to enable horizontal scaling of the API.
Email is provided by the Common Hosted Email Services (CHES) solution that is also managed by the Exchange Lab.
All access to data is performed by the centralized API. This API provides a single and consistent secure way to interact with the solution. For those who understand a pure event-based micro-service architecture, this would be a anti-pattern. The centralized API leans toward monolithic patterns, however it reduces complexity dramatically without losing many of the benefits gained by micro-services. The outcome however is that all services, while mostly independent still require access to the centralized API.
Nginx is used as a reverse-proxy to the two web applications. This provides the ability to use a single domain name for both the web application and the centralized API. Without a reverse-proxy the API would need its own domain name and as such require CORS and related security configuration. The default router provided through Openshift was found to be unreliable and would randomly stop forwarding requests that were supposed to go to the API to the web applications.
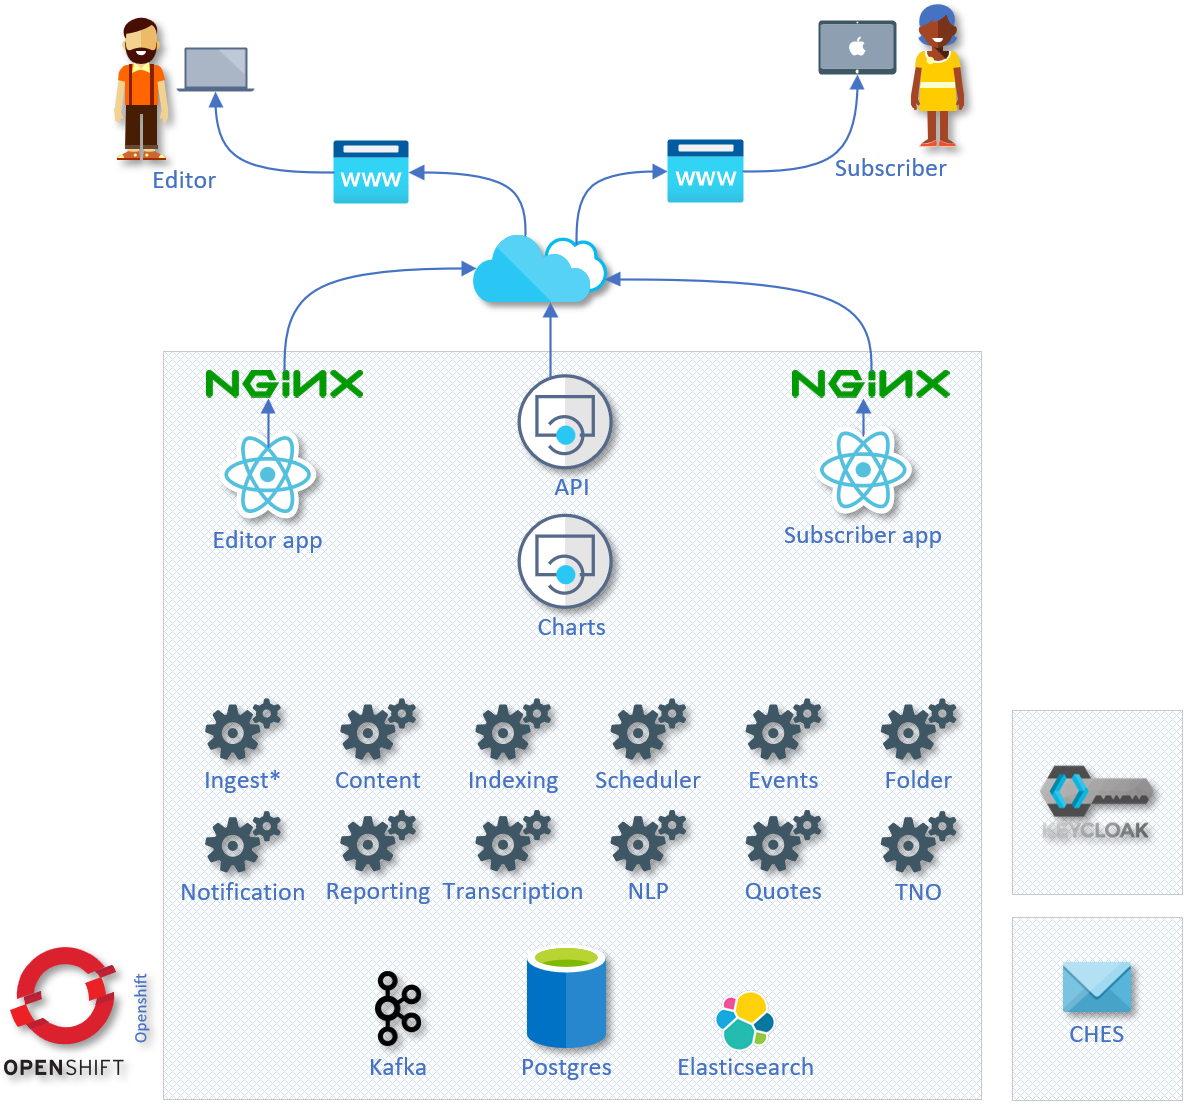
Content is added to the solution through two primary processes. The majority of content is automatically imported through the Ingestion Services. There are several to handle different types of content: Syndication, Papers, Images, and TNO Historical. Secondly, Editors and Subscribers can add content manually to the solution through their respective web applications. For Editors, this is the main source of audio and video content.
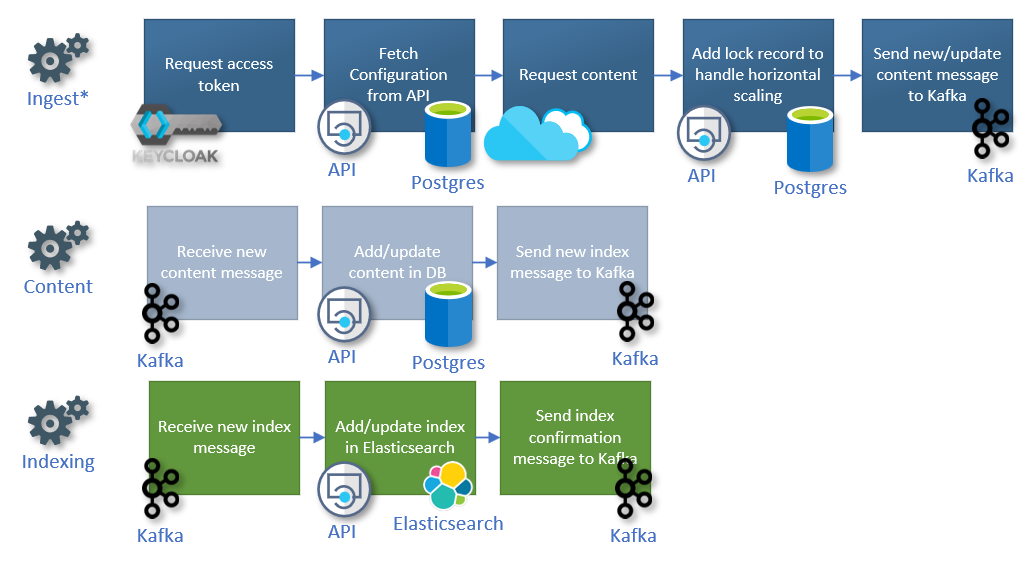
The following diagram explains how the ingestion process works. These services through configuration pull in content from 3rd parties and send messages to Kafka. Then the Content Service, which is a Kafka Consumer and Producer receives these messages and adds the content to the PostgreSQL database. Once it has completed its work it sends a new message to Kafka to ask for the content to be indexed. The Indexing Service, which is a Kafka Consumer and Producer receives this new message and indexes the content in Elasticsearch. Once it has completed its work it sends a new message to Kafka to inform the system that this content is now available to Subscribers. Which also results in other unrelated Kafka Consumer services to pick up the message and perform their respective actions to the content.
The Syndication Service makes HTTPS requests to fetch XML from 3rd party internet sites. Some of these are free, others require contracts to access the data. Syndication feeds are either ATOM or RSS format. However, most news sites that provide this content do not strictly follow syndication standards, as such it requires custom handling of their data.
This is called the File Monitor Service in the code base. It makes various requests for files that are either pushed to an SFTP location, or it makes pull requests for files in a remote SFTP location. These files are proprietary and as such each paper source must be handled differently.
Very similar to the Paper Service, in that these images are provided by various newspapers. This service either makes request for these images, or receives these images through SFTP locations.
This is called the Content Migration Service in the code base. It makes a direct connection to the old Today's News Online (TNO) Oracle database to fetch historical content so that it can be imported into MMI. This process is incredibly slow (we have yet to resolve this).
The centralized API is a .NET RESTful architecture. There are 'areas' that group related access requirements: Admin is for administrators, Editor is for editors, Subscriber is for subscribers, Services are for the services. Each area contains controllers which group related endpoints. All endpoints are configured with authentication and authorization attributes. Models are used to control what is serialized into and from JSON. Generally models are unique to each controller. This is to reduce overlap and regression issues as models are modified over time. The API itself is only focused on handling requests, validating access tokens and then passing the work off to the data access service layer. The data access service layer applies business rules, logic, constraints, and has direct access to the data in the various databases.
The Editor application is a React web application that is for internal staff. This staff curates the content and publishes relevant stories. The Editor application provides the UI for nearly all configuration options with the solution.
The Subscriber application is a React web application that is for external users. Subscribers can read, watch, listen to all the content in MMI. The application draws attention to various categorization of content, such as top stories, features stories, commentary, press gallery and more. Subscribers can request they receive alerts or reports that are part of the product offerings. Additionally, subscriber can create and generate their own reports from the solution.
There are many micro-services to the solution that perform dedicated roles. Many of these services are multi-threaded applications that have a configured limit on how many sequential errors they will allow before they stop running and change their status to 'Failed'. Many of these services will restart automatically after a configured number of seconds, but some do not.
This API is a Node.js Express.js RESTful application. It provides endpoints that generate chart images from the supplied JSON configuration. It uses the Charts.js package to perform this work.
A Kafka Consumer that places imported content into the PostgreSQL database.
A Kafka Consumer that indexes content into Elasticsearch.
A Kafka Consumer that sends out email notifications to subscribers when content is alerted. A request is sent to CHES as a mail merge. This means one request is sent to CHES and it sends it to all the subscribers. A record is kept in MMI for each mail merge sent out.
A Kafka Consumer that generates reports and sends out emails to subscribers. The Reporting Service will generate and/or send reports based on the requested action and configuration of the report. A request is sent to CHES for every single subscriber independently. A record is kept in MMI for each request to CHES. If a report fails to generate or send for any reason it will be added back to the Kafka queue and another attempt will occur. The service will pick up where it left off and only send the report to subscribers who have not yet received it. After a configured number of failures the service will give up and leave the report in a failed state.
A Kafka Consumer that extracts the text from audio content.
A Kafka Producer that initiates reports and notifications based on configured schedules.
A Kafka Consumer that can perform various actions. Currently it is used to empty folders of content.
A Kafka Consumer that adds content to folders based on filters.
A Kafka Consumer that extracts keywords and information from text. This service is currently disabled.
A Kafka Consumer that extract quotes from text. This service is currently disabled.
A Kafka Consumer that converts audio and video files into a format that is supported by common browsers.
A Kafka Consumer that copies files from one location to another. This was originally used to copy files from the server room NAS to Openshift. This service is currently disabled.
To support the solution Openshift expertise are required. You will need access to the production environment.
Any user interface bugs will need to be determine through review of screenshots and or shared screens to determine a way to replicate the issue. Then they can be prioritized and addressed through a user story.
When the either the Editor or the Subscriber application is unaccessible due to gateway errors, it is most likely the route in Openshift is failing, or Nginx is failing.
Go to the editor and/or subscriber DeploymentConfigs. View each pod and its logs to determine if they are running. If they are running without errors, then do the same for the respective Nginx DeploymentConfigs named nginx-editor and nginx-subscriber. If they are running without errors, then review the Networking Routes in Openshift editor-tls, subscriber-tls. If they are running without errors, then it is most likely a intermittent networking issues that will resolve itself in a few minutes, however you should post an inquiry to the RocketChat channel devops-sos.
Gateway errors can also be thrown by the API. In this scenario the web applications will be working, the user will be logged in, but all requests to the API are throwing errors. View the Statefulset api pod(s) in Openshift to determine what is causing the error. It may be that the API is not able to connect to the database, Elasticsearch, or some other service.
There are two primary issues that can result in reports not being sent out. The first is if the Scheduler Service has gone offline. The second is if the report has errored out and the Reporting Service has given up attempts to resend.
Review the Scheduler Service pod logs to determine if it has errored out. Currently the Scheduler Service does not have a automatic process to start running again. A catastrophic failure where the pod dies will automatically restart, but not one of the handled issues. To fix these types of common issues simple kill the pod and it will restart automatically, picking up where it left off. If it continues to fail review the logs to determine what the repeating issue is.
Review the Reporting Service pod logs to determine if there are repeating errors. A failed report should be added back to the Kafka queue to be retried. However, it will only do this a configured number of attempts before giving up.
Confirm that the subscriber is configured to receive the specified notifications. This is done through the Editor Notification Administration pages, and the Product Administration pages. If they are, then review the Notification Dashboard to see if any notifications were sent out and failed to be sent to the user.
Check if the specified notifications have been sent out to any subscribers. The Notification Dashboard can be used for this, or make a connection to the production database and query the notification_instance table.
One of the common issues is when the notification filter has a value that result in no content being sent out.
Note that if a subscriber is configured to receive emails as BCC or CC it will mean that the email must be sent TO the owner of the report. This makes it difficult to determine if these emails were ever sent to the subscriber.
Confirm that the subscriber is configured to receive the specified reports. This is done through the Editor Report Administration pages, and the Product Administration pages. If they are, then review the Report Dashboard to see if any reports were sent out and failed to be sent to the user. The Report Dashboard only shows the most recent reports sent out. You can also make a connection to the production database and query the report_instance and the user_report_instance tables.
One of the common issues is when a report fails multiple times it will not be able to send an email to all or any of the subscribers. Review the Reporting Service pod logs to determine what the error is. If it was an intermittent issue, you can use the Subscriber app, impersonate the owner of the report and resend it. It will pick up where it left off and send to anyone who hasn't receive it yet.
Note that if a subscriber is configured to receive emails as BCC or CC it will mean that the email must be sent TO the owner of the report. This makes it difficult to determine if these emails were ever sent to the subscriber.
The most common reason for this is the filters (saved searches) used to populate the report sections is not correct. The Subscriber app has the best UI for viewing and debugging reports, however the Editor Report Admin pages provide a few extra tools that can be useful (specifically the Instances tab).
Reports are often linked to the prior instance. An report instance is a new copy of the report. A common configuration is to not include any content found in the prior report instance. If for some reason the report has been generated multiple times in a short period of time, it can result in unexpected content results. More often including content that was in a prior historical report. There is no 'fix' for this because the system will only ever look back one instance.
Technically the database should continue working even if there is only one node left running, however sometimes there are performance issues when this occurs.
- CrunchyDB repo volume has run out of space
- CrunchyDB node volume has run out of space
- Openshift has failed and all volumes have become corrupted
- Database has been corrupted
Regrettably there is no way to deal with this issue. At times the repo will randomly and very quickly fill up with logs. All that can be done if possible is to keep increasing the size of the volume. The challenge with this approach is that there is limited space allocated/available and once it's assigned you can reduce it.
This should not occur if support staff are receiving emails about volume usage percentage. The solution is to increase the size of the volume. If it does occur, just increase the volume size and it should resolve eventually.
This is the worst case scenario. Stop the whole solution (every service pod). The repo volume is a backed up volume. Request the assistance of the Exchange Lab and they can recover that volume from a prior backup. Then restore the database from a backed up copy. Once the database has been restored, determine if the CrunchyDB cluster is working again. If so start all the services that you stopped. Depending on the timing of all the issues, there will most likely be lost data.
Stop the whole solution (every service pod). The database should be automatically backed up every night. Restore the database from a prior copy. Once the database has been restored, determine if the CrunchyDB cluster is working again. If so start all the services that you stopped. Depending on the timing of all the issues, there will most likely be lost data.
There are four permanent volumes for Kafka. Theoretically it can recover as long as there is one remaining. However, the system cannot be running when there are less than three. If all four permanent volumes are lost due to a catastrophic Openshift failure, there is nothing that can be done to restore. Stop the whole solution (every service pod). Deploy each Kafka pod, one at a time, wait until the pod is running before starting the next. Use the helper scripts in the root repo to add topics to Kafka make kafka-update.
The loss of Kafka isn't always catastrophic. Generally speaking if there was little or no lag before the failure, then very little will be lost. Perhaps some content, missed alerts, and missed reports. Currently, the primary lag is only related to the TNO History migration. The bigger issues is the time it takes to get everything working again.
Another common failure related to Kafka is caused when Openshift has an outage and all pods are killed at the same time. This results in the cluster having syncing issues that need to be manually resolved.
There are three permanent volumes for Elasticsearch. Theoretically it can recover as long as there is one remaining. It takes Elasticsearch a few minutes to switch the master node when it fails. If all three permanent volumes are lost due to a catastrophic Openshift failure, there is nothing that can be done to restore. Stop the whole solution (every service pod). Deploy each Elasticsearch pod, one at a time, wait until the pod is running before starting the next. Use the helper scripts in the root repo to add indexes to Elasticsearch make elastic-update. You will now need to re-index all content from the database. There is an endpoint in the API Services area called ReindexAsyncn, the path is /api/services/content/reindex. Changes will need to be made to the endpoint to support re-indexing the whole database, as presently it only will do 500 items at a time. This process could takes days to complete to get all content back into Elasticsearch. You will need to reindex only the last few days first so that the solution can be turned back on.