Extracting features
This feature is only available from version 1.1.2 onward.
If you have run inferCNV with the HMM predictions enabled, it is possible to extract a range of feature vectors such as the proportion of expressed genes part of a CNV in a given chromosome per cell, which cells have gains in a given chromosome, or which cells have the largest CNVs (in number of expressed genes).
The feature vectors are exported as a table "map_metadata_from_infercnv.txt" to be used with any other analysis. If you have a Seurat object matching the same data, you can also provide it to inferCNV to add the information to its meta.data field to easily display it on a tSNE or UMAP.
seurat_obj = infercnv::add_to_seurat(infercnv_output_path=path_to_your_infercnv_run_folder,
                                     seurat_obj=your_seurat_obj, # optional
                                     top_n=10
                                     )
Using Seurat's methods, you can then plot the different results to check their repartition. In the following examples, the Seurat object contains a tSNE plot, and the cells are from 4 different patients.
Note: For scaled duplication, the value can go above 1 in cases where more than 2/3 of the chromosome has 3+ copies gained. You can adjust the limits to c(0,1.5) in those cases.
png("proportion_scaled_dupli_9.png")
FeaturePlot(seurat_obj, reduction="tsne", features="proportion_scaled_dupli_9") + ggplot2::scale_colour_gradient(low="lightgrey", high="blue", limits=c(0,1))
dev.off()
png("proportion_scaled_loss_1.png")
FeaturePlot(seurat_obj, reduction="tsne", features="proportion_scaled_loss_1") + ggplot2::scale_colour_gradient(low="lightgrey", high="blue", limits=c(0,1))
dev.off()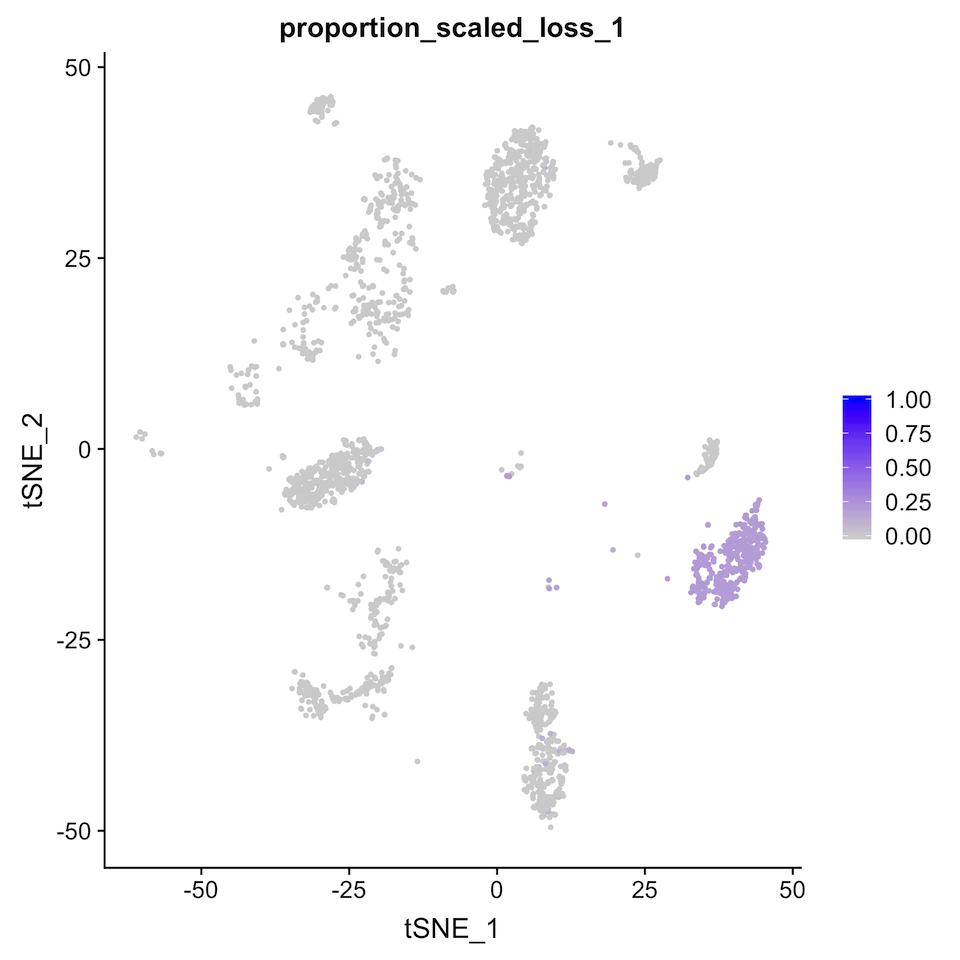
png("proportion_scaled_loss_20.png")
FeaturePlot(seurat_obj, reduction="tsne", features="proportion_scaled_loss_20") + ggplot2::scale_colour_gradient(low="lightgrey", high="blue", limits=c(0,1))
dev.off()
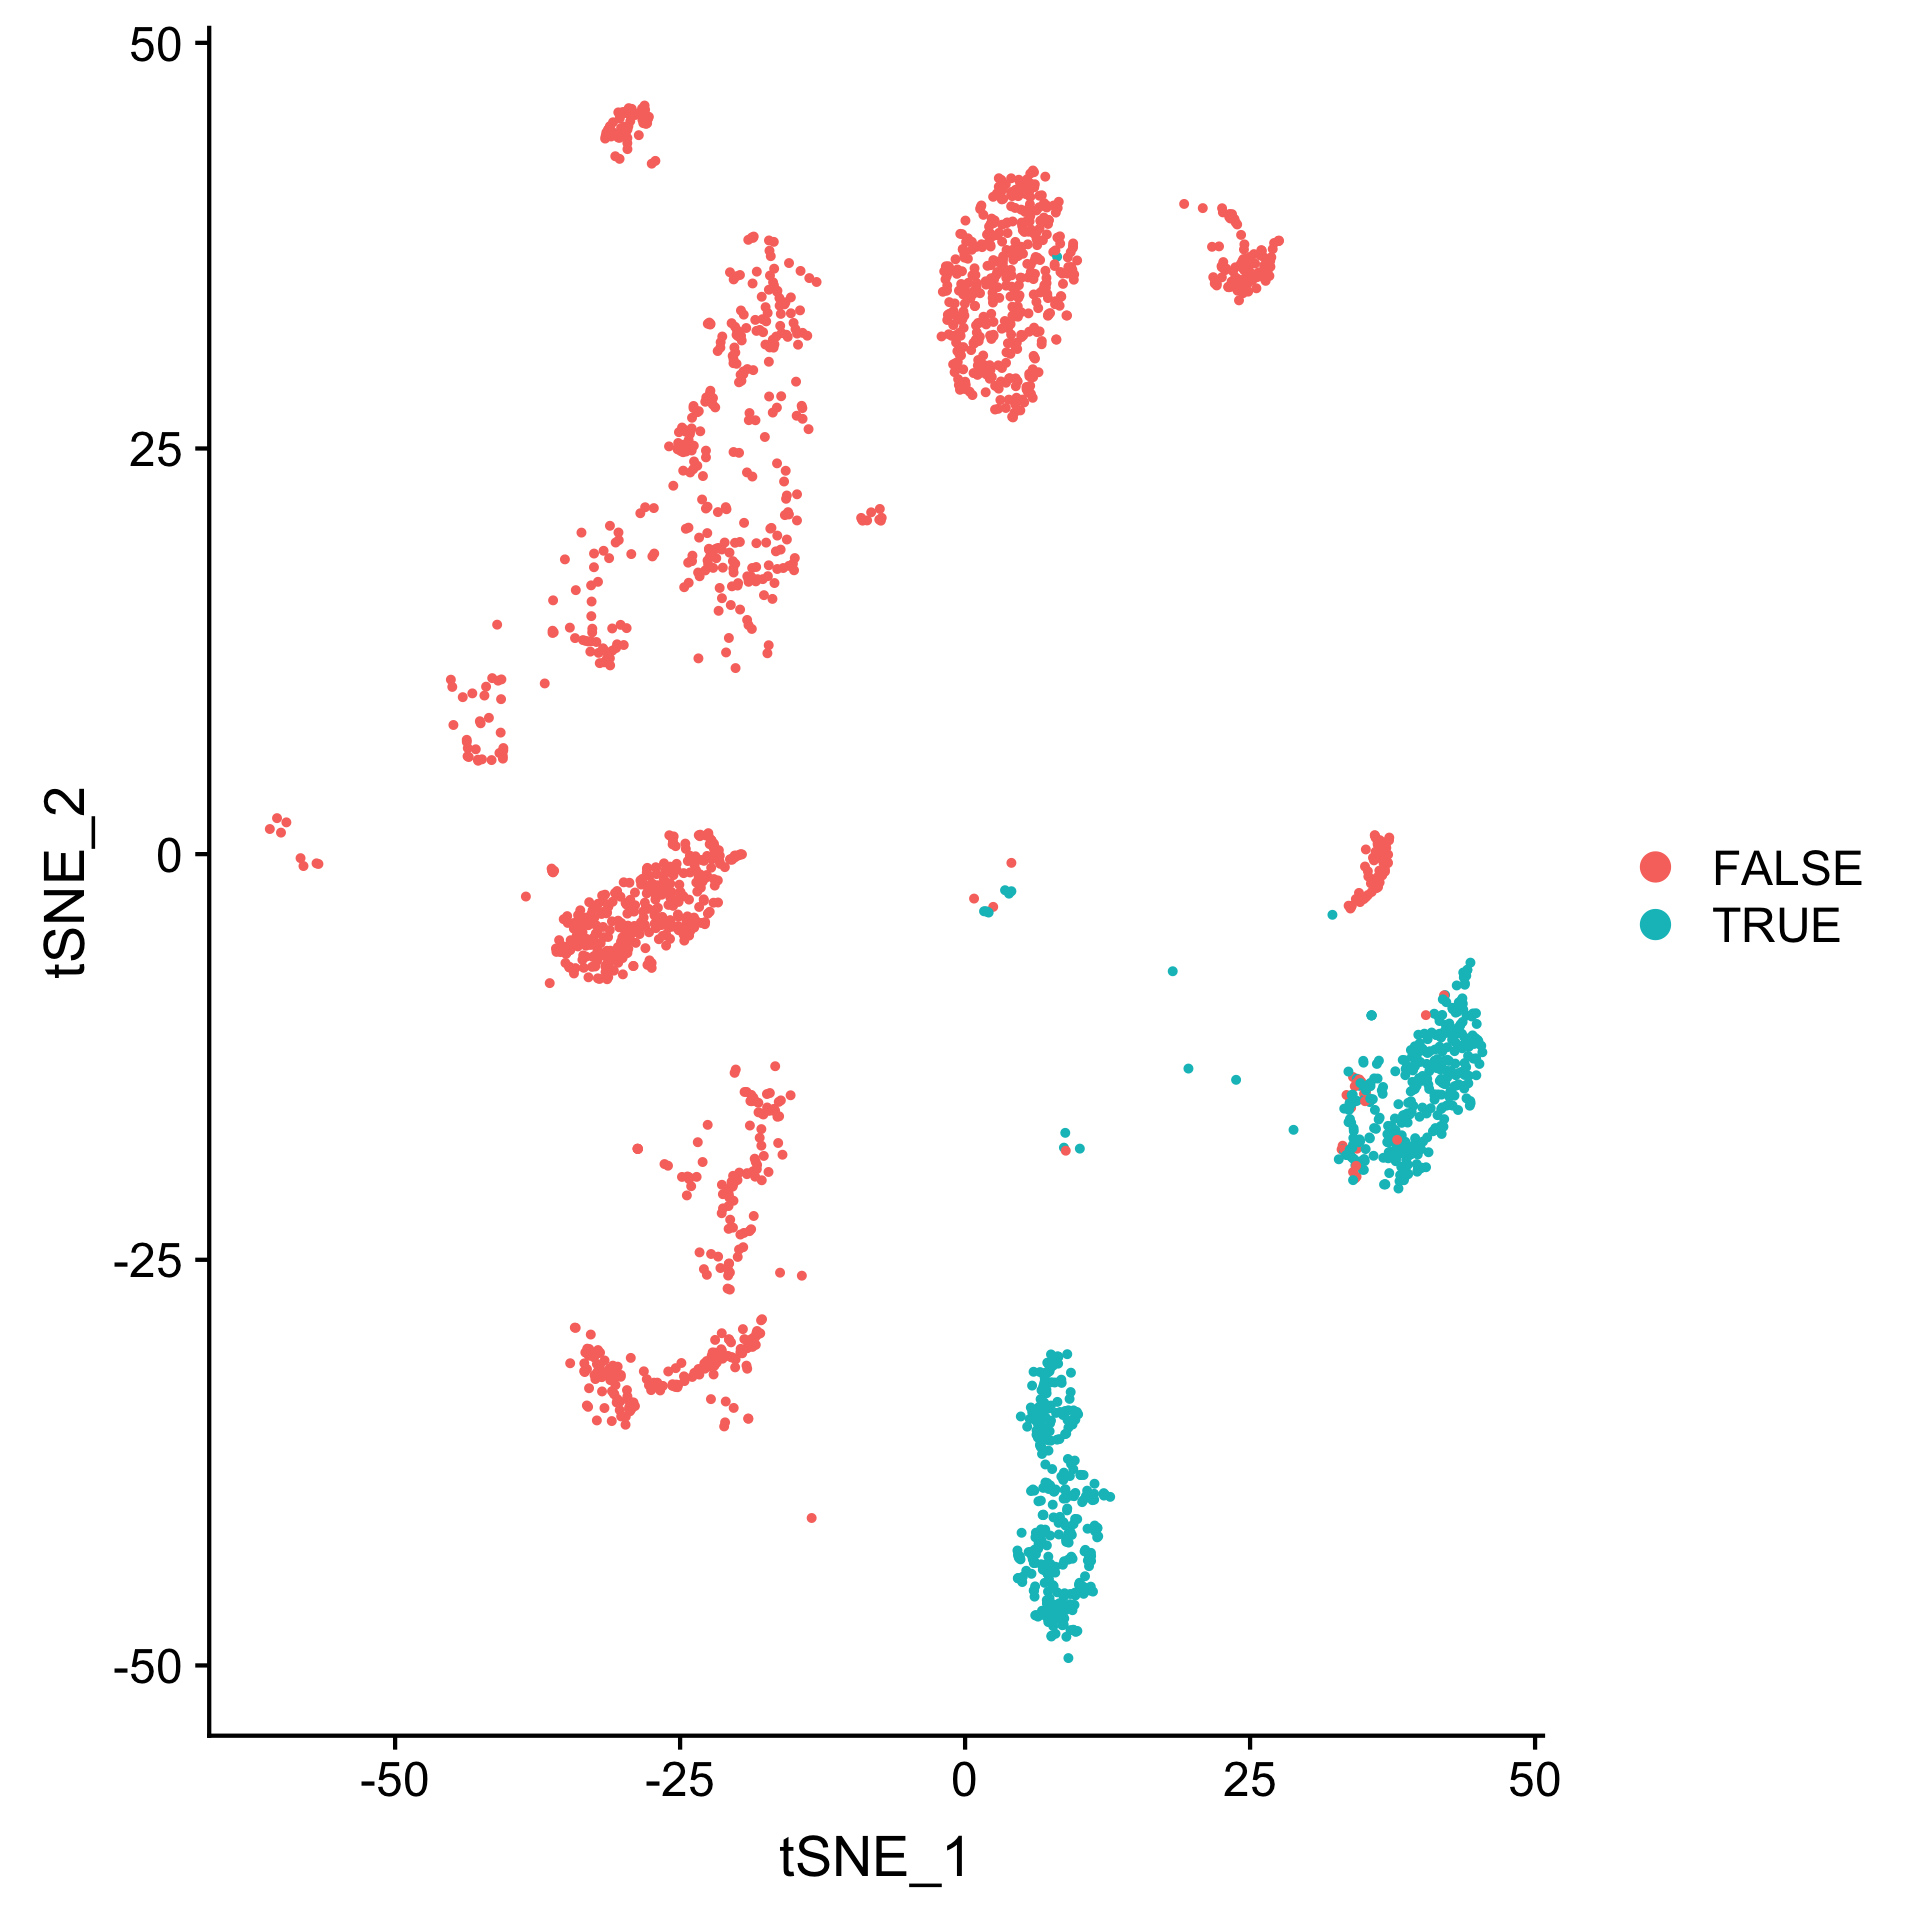
png("top_loss_2.png", width=1920, height=1920, res=288)
DimPlot(seurat_added, reduction="tsne", group.by="top_loss_2", pt.size=0.5 )
dev.off()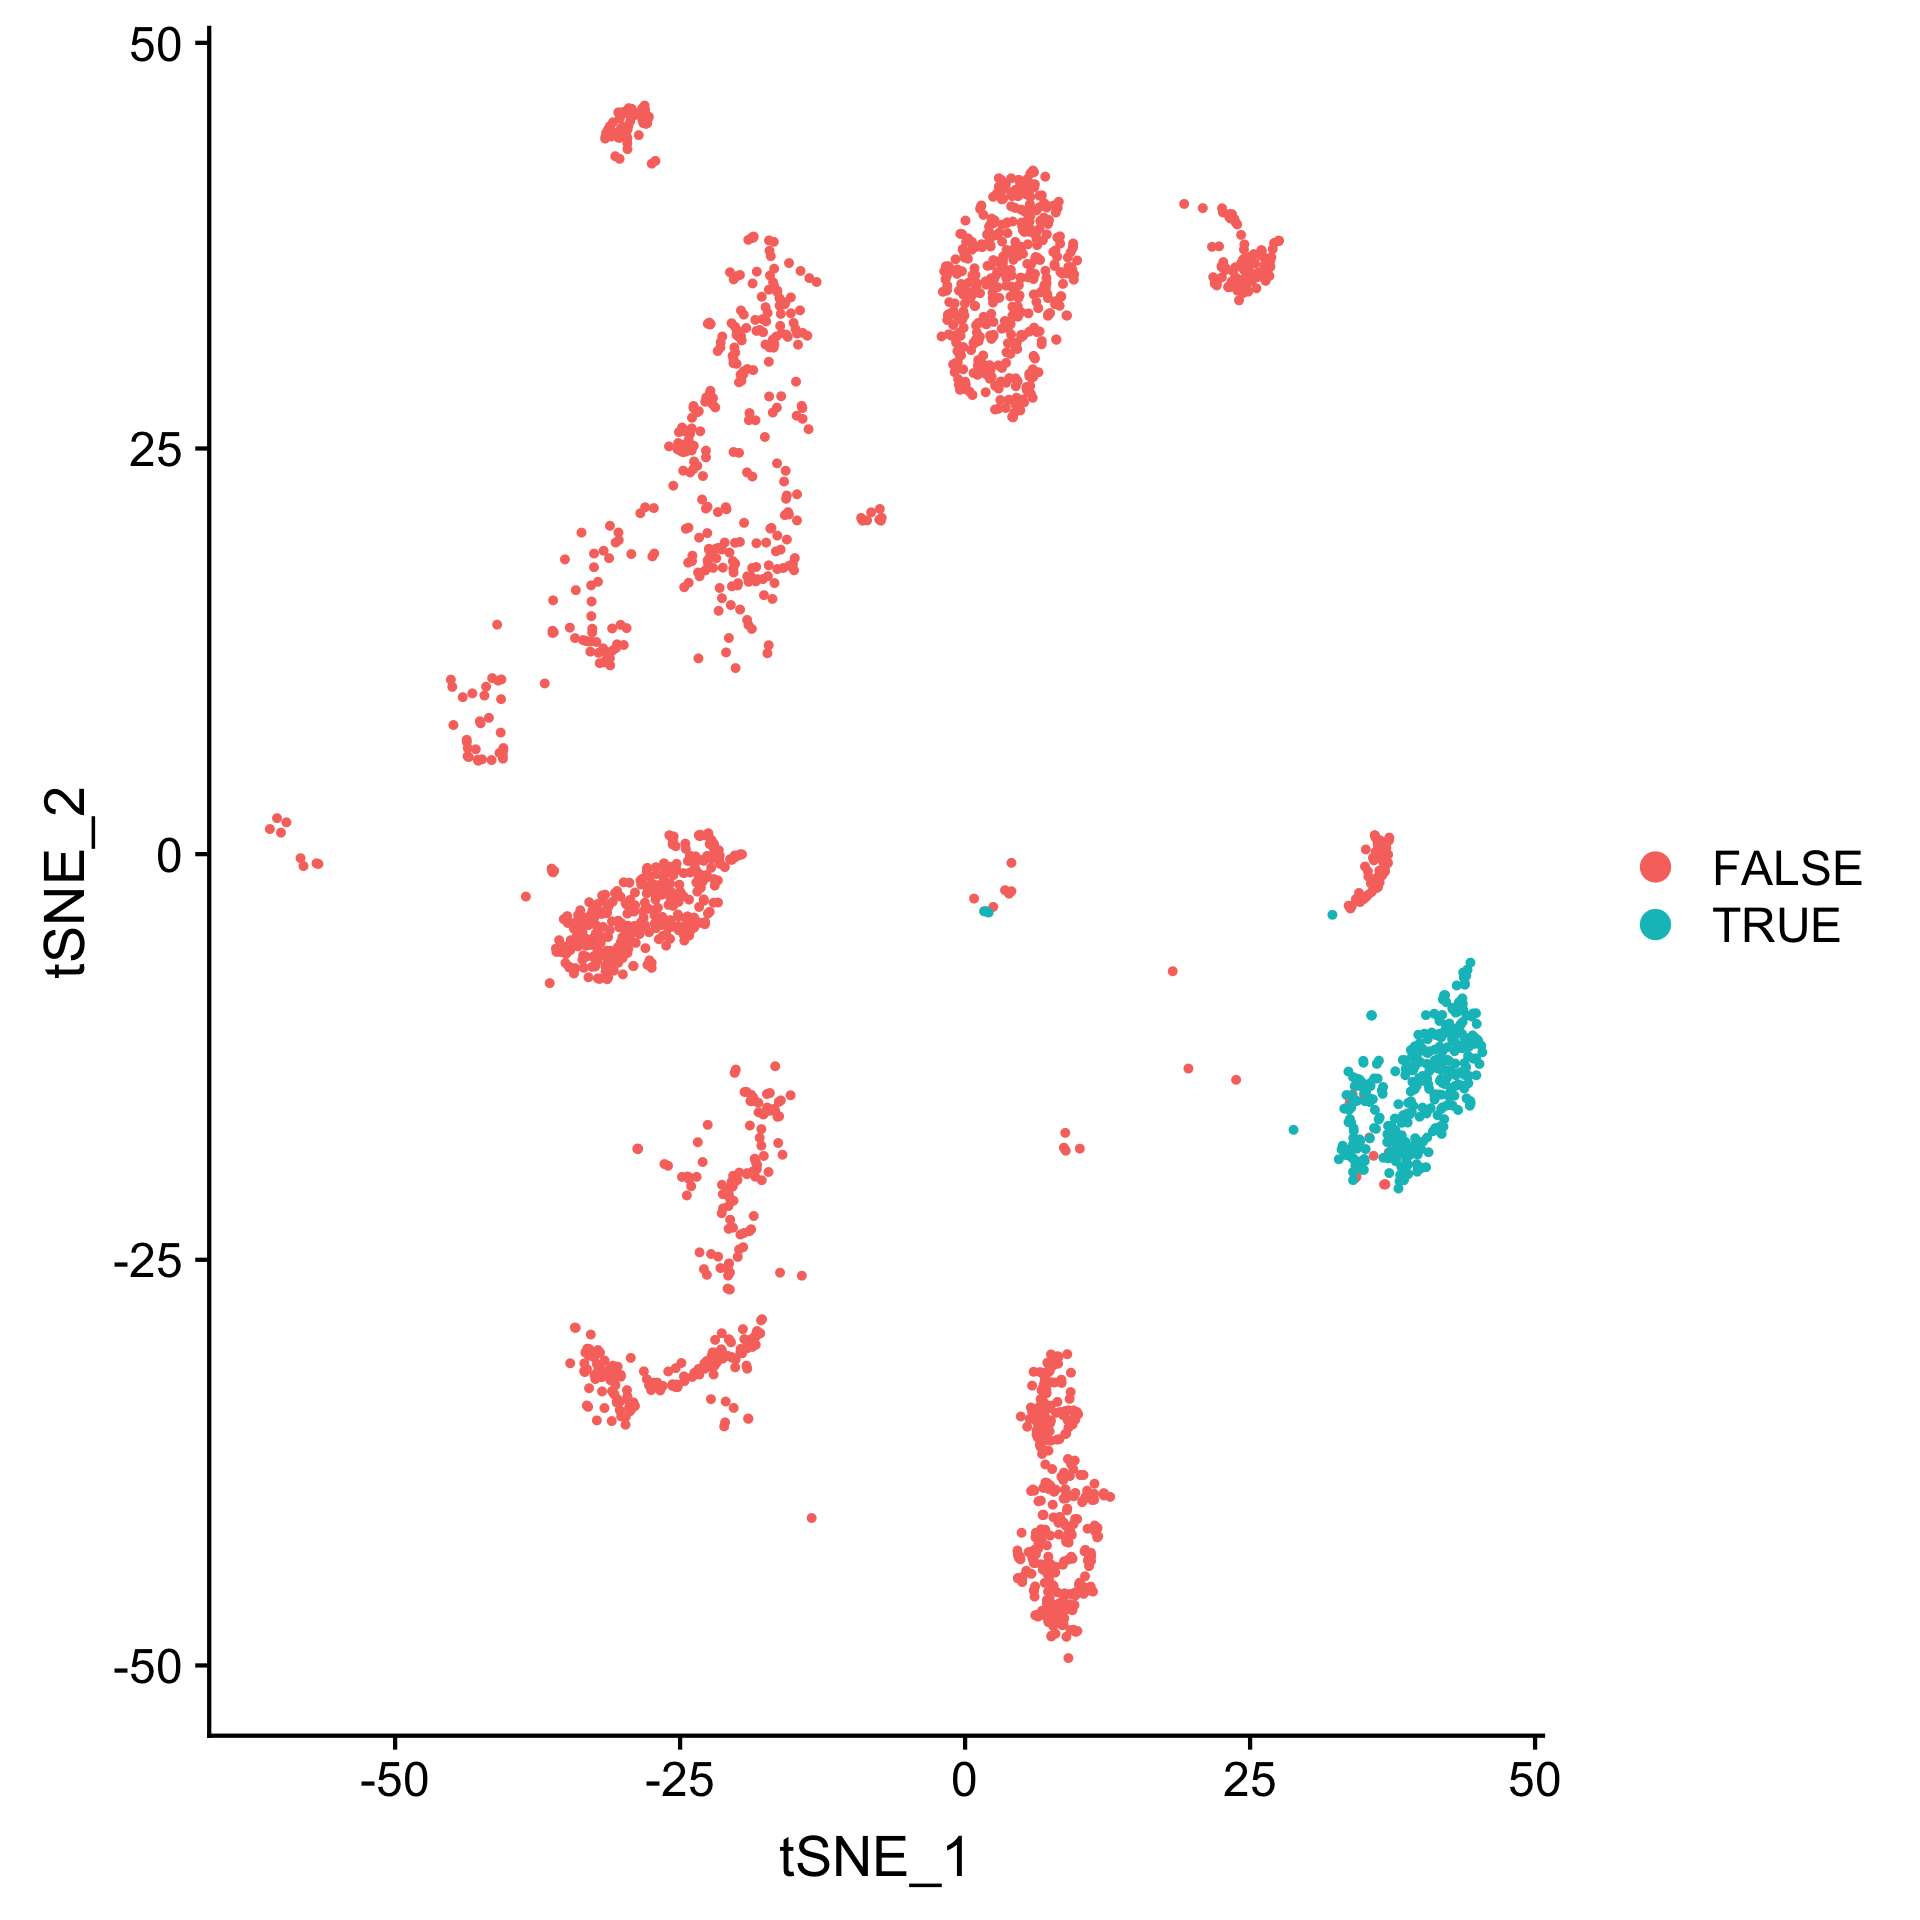
png("top_loss_5.png", width=1920, height=1920, res=288)
DimPlot(seurat_added, reduction="tsne", group.by="top_loss_5", pt.size=0.5 )
dev.off()