TORQUEView is a GUI analysis tool for TORQUE. It is used to visually monitor the health of an entire TORQUE cluster at a glance and lets users quickly move to any troubled spots and drill in to diagnose problems.
TORQUEView was developed using the Qt application framework and needs to be built with QtCreator. Qt is an environment that lets you build and run TORQUEView on most Linux distros, Mac OS, and Windows.
-
Download the Qt framework from: http://qt-project.org/downloads
-
Choose the "Download Qt Here" button, which takes you to:
-
Choose the "Community" download button (NOTE: the Community version of Qt has no license fee, so choose this one.)
- Download/clone the source from github at:
https://github.com/davidivanmarsh/TORQUEView
-
Run qtcreator. NOTE: TORQUEView can be run either by root or non-root users (non-root users will have admin-specific capabilities disabled).
-
Open the TORQUEView project file (File->Open File or Project). The project name is the file that ends in ".pro" (so for TORQUEView, the project name is "TORQUEView.pro")
-
To build TORQUEView, click Build->Build All, or just click on the build icon (hammer) in the lower-left corner of the screen.
-
To run TORQUEView, click the green arrow at the bottom left corner of the screen (for Release), or the green arrow with the circle in it (for Debug). This will also build it if it isn't built.
- Make sure you have ssh key encrpytion set up for each of the servers you want to access.
David I. Marsh Last updated: 10/28/2014
The TORQUEView is designed as a TORQUE GUI analysis and diagnostics tool. It lets you visually inspect TORQUE node and job lists, and allows you to control TORQUE operation by issuing a variety of commands to those nodes.
TORQUEView was developed using the Qt development environment to allow the application to be built and run on a variety of platforms, such as Windows, Linux, and Mac OS.
All of TORQUEView's features are powered by execution of TORQUE console commands, accessing either local or remote TORQUE systems (remote commands are issued via ssh calls). Data is extracted from STDOUT output, and is then parsed and displayed on the various tabs and panels.
One of TORQUEView's most unique features is its snapshot capability, which lets you take a "picture" of the condition of a TORQUE system, saving out all node and job state information at a specific point in time. This snapshot can then be loaded and inspected as often as necessary. Even more interesting, a series of snapshots can be taken in succession, and then later replayed to let you watch the changes in the system's nodes and jobs over a period of time.
Note that TORQUEView uses SSH key-based authentication for access to remote servers (password based authentication is not yet supported). You can setup ssh keys with the tool 'ssh-copy-id'.
TORQUEView can be run by users either with or without admin rights (i.e., "root" or "non-root" users). Non-root users will have admin-specific capabilities disabled.
Also note that TORQUEView does not currently support Cray systems.
The "Data source" combobox lets you choose which TORQUE data to access and display in the TORQUEView tabs. With this you can analyze either a local host, a remote host, or a snapshot file.
When Remote Host is selected in the combobox, you choose the remote server to analyze from the Remote Server combobox to the immediate right (SSH key-based authentication is required for access to remote servers). Specify which remote hosts to include in your list by clicking the "Edit" button next to the combobox.
When Snapshot is selected, you indicate the name of the snapshot file to load from the associated edit field (this reads in data from a snapshot file and updates each of the tab windows from that data).
The "Refresh" button lets you refresh the display (all the tabs are updated). Using the "Auto-refresh" checkbox, the refresh happens automatically, letting you indicate the refresh interval rate.
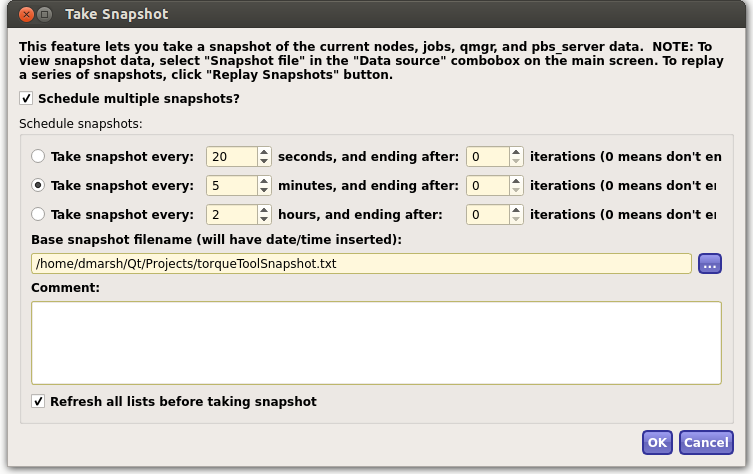
TORQUEView's Snapshot feature allows the user to write out the server's current state (i.e, all panel displays) to a file, and then reload this file later on if desired.
The Snapshot feature is intended primarily as a diagnostic tool so users experiencing problems can take a picture of their system for analysis. The "Snapshot" dialog lets you save all the current TORQUEView screen display data to a file. You can take either a:
- single snapshot, or
- a series of snapshots, where you specify the base-filename of the set (date & time stamps will be added to each filename), and where you indicate the time interval between snapshots.
The "Replay Snapshots" button lets you replay a collection of related snapshots, indicating the time interval between snapshot displays (this value is totally independent of the interval used when generating the snapshot series). After you click the "..." browse button, you only need to select one filename from the set-- the "File to be Replayed" list will be refreshed using all filenames having that same prefix. Then to start the replay, click OK.
Once the replay is started, the user can control the playback with the Pause, Resume, Next, Back, and Cancel buttons on the statusbar.
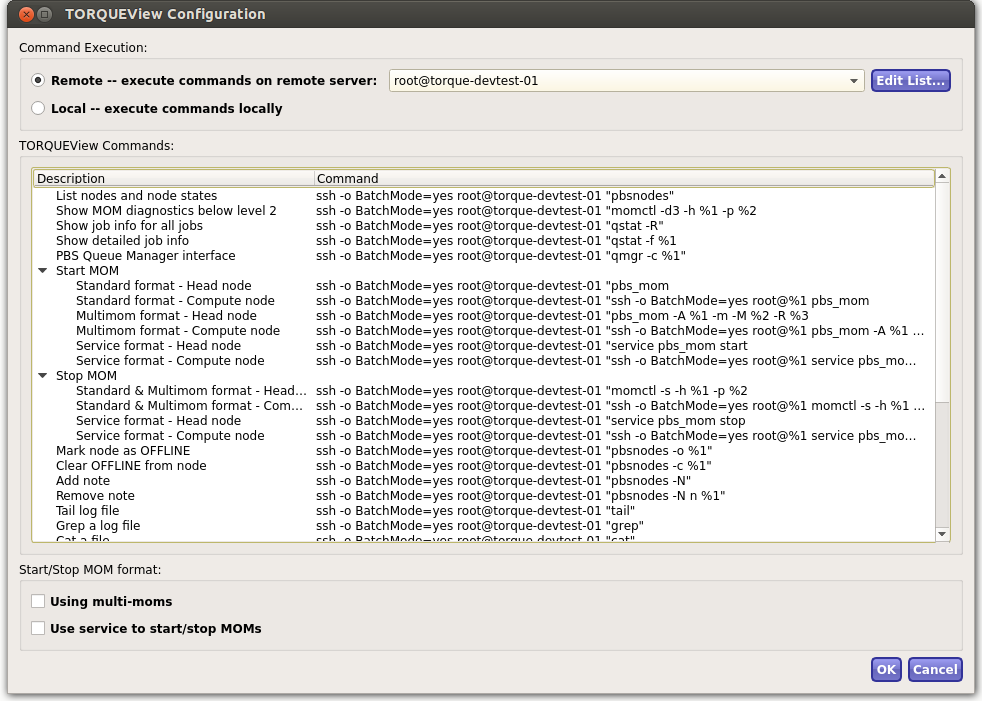
The "Config" button on the main panel brings up the Configuration dialog box. The "Remote" and "Local" radio-buttons let you see the command set TORQUEView will use for either local or remote TORQUE servers. If you choose "Remote", the Edit List button lets you create and edit a list of TORQUE servers to analyze. These are used to populate the "Remote host" combobox on the main panel. The "TORQUEView commands" list shows all the commands currently being exercised when selecting TORQUEView options. Commands are automatically modified when switching between local and remote execution mode, or when selecting new remote servers. The "Start/Stop MOM format" lets you specify whether it's a "multi-mom" configuration, or whether you want to user "service" commands to start and stop MOMs. The strings used to start or stop a MOM will differ depending on your choice here.
The five tab windows in TORQUEView are titled: heat map, nodes, jobs, qmgr and pbs_server.
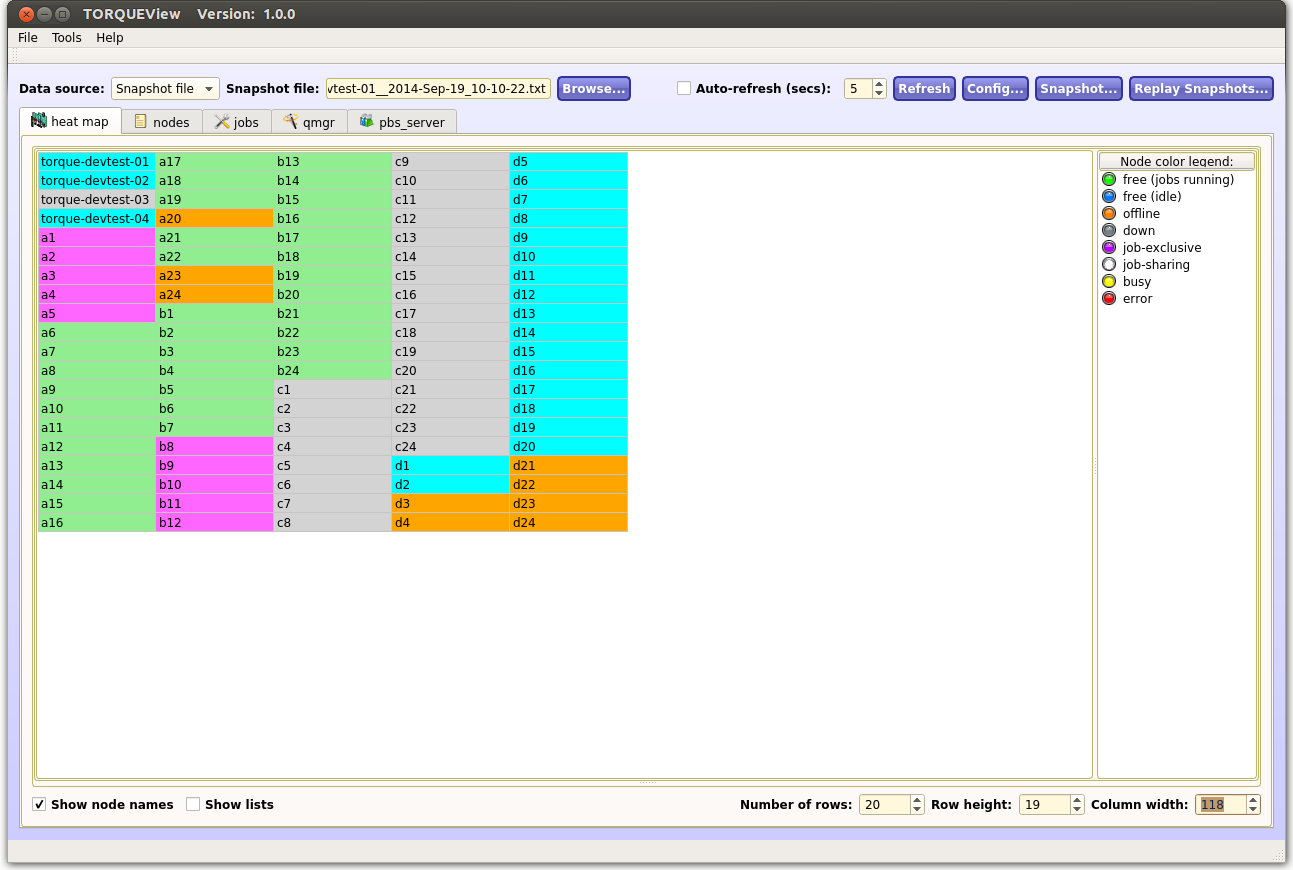
The "heat map" tab displays a table of all nodes on the server, showing the current state of each node as a color-coded icon. It can show nodes either with or without names (labels). It is most useful when displaying a large number of nodes and their states, letting the user see the state of the entire system at a glance.
The heat map's row height, column width, and number of rows displayed are configurable. TIP: use the up/down arrow keys on the keyboard to change these values, rather than clicking the mouse on the up/down arrows in the spin box.
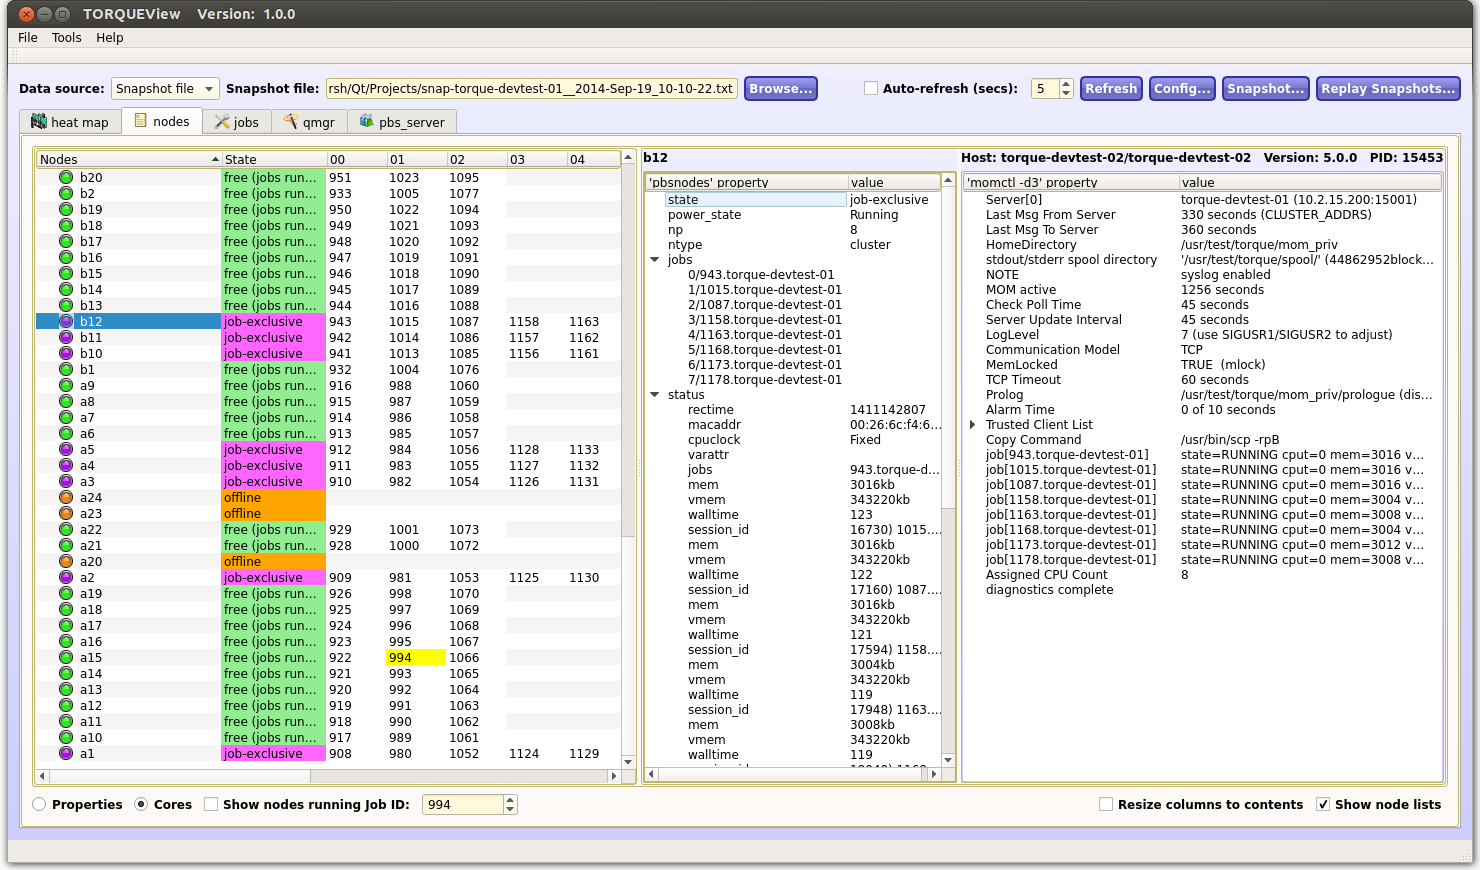
The Nodes tab shows three node-related lists. The node list is the primary list in the tab window, and is populated from the output of the "pbsnodes" TORQUE command. The second and third lists show data for individual nodes, which is generated from "pbsnodes" and "momctl -d3" command output.
Depending on which radiobutton you click at the bottom of the screen, "properties" (called "features" in Moab) or "cores" information is also displayed in the node list. When displaying cores, the column headings in the node list indicate the core number ("00" to the max core value), and the column values show job IDs and indicate which job is being run on that core on that node. Double-clicking on a job ID will highlight in yellow all the locations (nodes and cores) where the job is being run.
The "Show nodes running job ID" checkbox is a filter that will show only the nodes running that specific job, and will highlight those job IDs in yellow. Unchecking it once again displays the entire list of nodes, but will continue to highlight the matching job IDs in yellow.
When right-clicking on a node in either the heat map or nodes tab, a context menu lets users:
- start a MOM
- stop of MOM
- mark node as OFFLINE
- clear the OFFLINE designation from the node
- add a note (annotation) to a node
- remove the note (annotation) from the node
- bring up a log viewer to display the log file contents of that node's MOM (it automatically starts executing "tail -f" on the file). To start performing the tail f, click the "Run tail -f" checkbox; to stop, uncheck the box. Contents of the log viewer's window can be saved to a file with the Save As button. For searching, the log viewer lets you switch between a normal "Find" operation (on the contents of the log viewer window), or if you click the "Use grep" checkbox, it lets you indicate a grep pattern with options (this is done on the original file read in, not the contents of the window.) Note that TORQUEView requires SSH key based authentication for each remote MOM you want to access. You can setup ssh keys with the tool
ssh-copy-id. - highlight all occurrences of the selected job ID across all nodes and cores
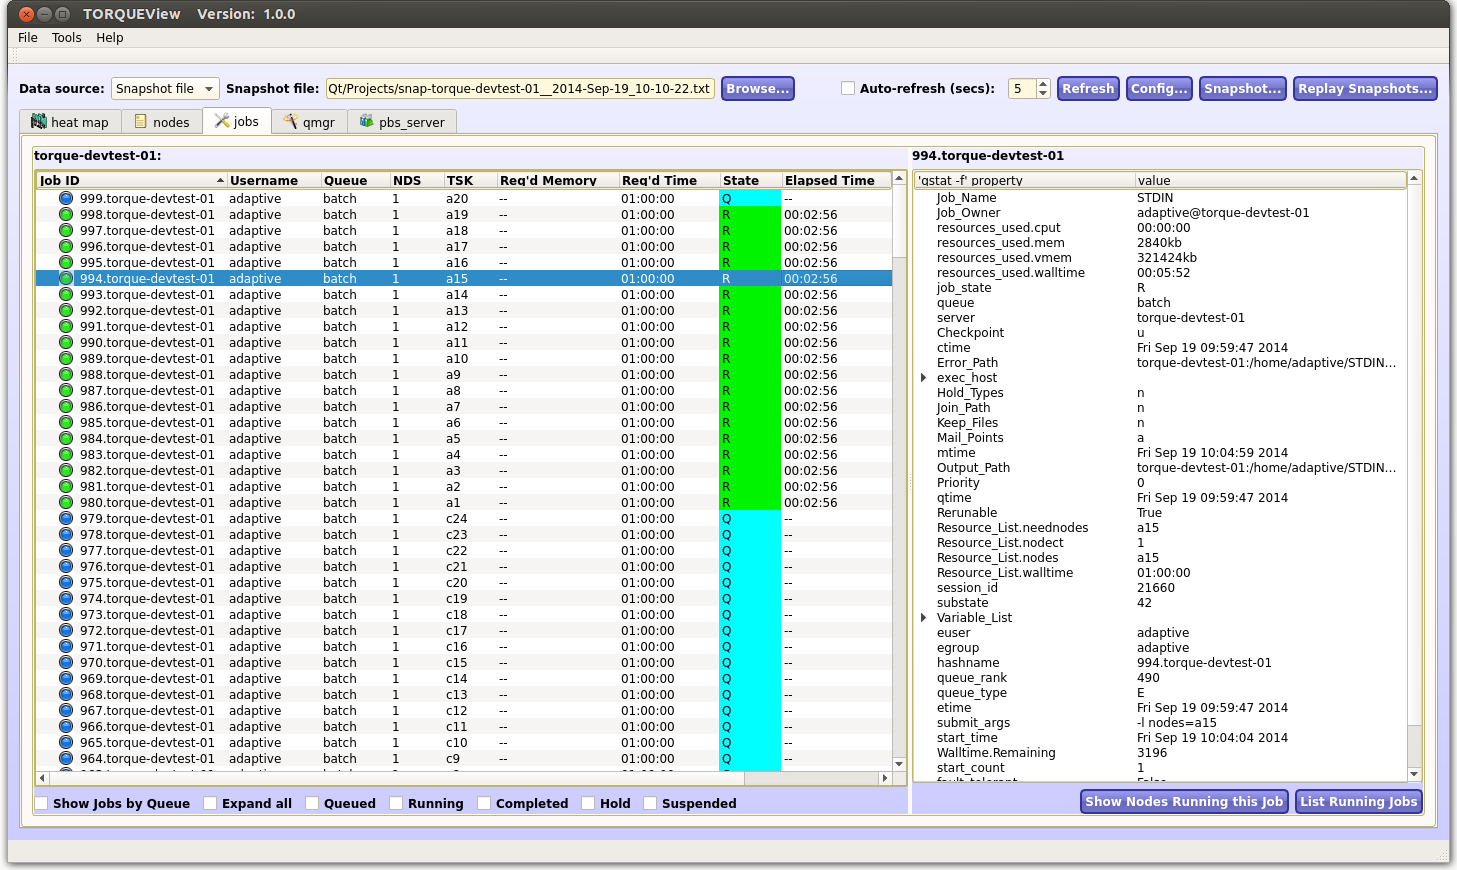
The jobs tab shows a list of all the jobs running on the nodes, and is populated from output from the "qstat -R" results. When a job is selected in the list, "qstat -f" data is displayed for that job in a separate panel on the right. If a running job is selected in the jobs list, the "List Hosts Running this Job" button on the lower right will display the host and procs where the job is running (this is essentially a formatted output of the "exec_hosts" and "exec_ports" fields in the "qstat -f" output).
By clicking the "Show Jobs by Queue" checkbox, jobs can be shown heirarchically by queue name. Also, the job list can be filtered by checking any combination of the Queued, Running, Completed, Hold, or Suspended checkboxes.
Clicking the "Show Nodes Running this Job" button will return the user to the nodes tab and will designate all nodes that are currently running the specified job.
When right-clicking on a job in the list, a context menu lets users:
- run a job
- delete a job
- put a job on hold
- release the hold on a job
- rerun a job
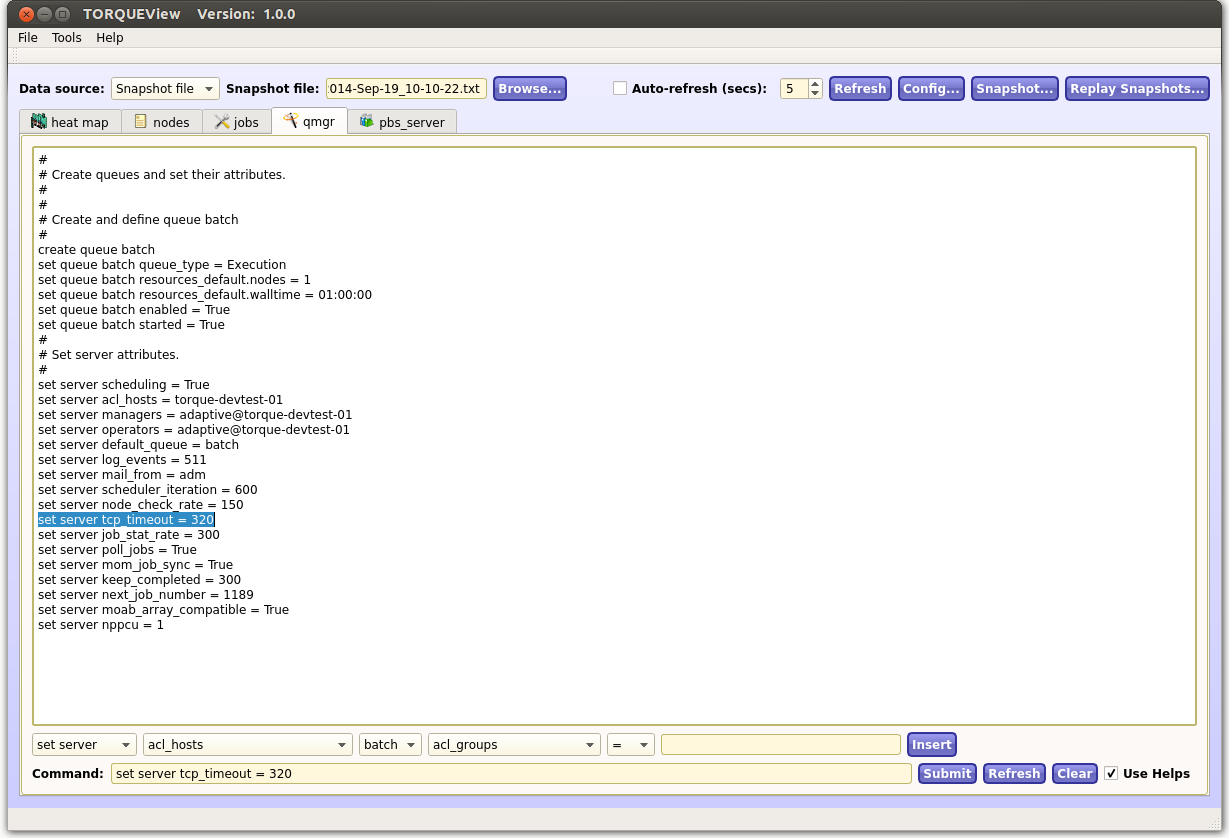
The qmgr tab provides a GUI interface for the "qmgr" TORQUE command, letting you to issue specific qmgr commands and see the results immediately in the main "qmgr -c 'p s'" output window. As an assist, you can click on a line in the output display (which displays that line in the "submit" edit field below) and modify it before submitting it.
Finally, by clicking the "Use helps" checkbox, you can use a set of "submit-builder" controls that assist in creating a command line to be submitted. (Click "Insert" to copy the constructed line into the "Command" edit line, and then click the "Submit" button).
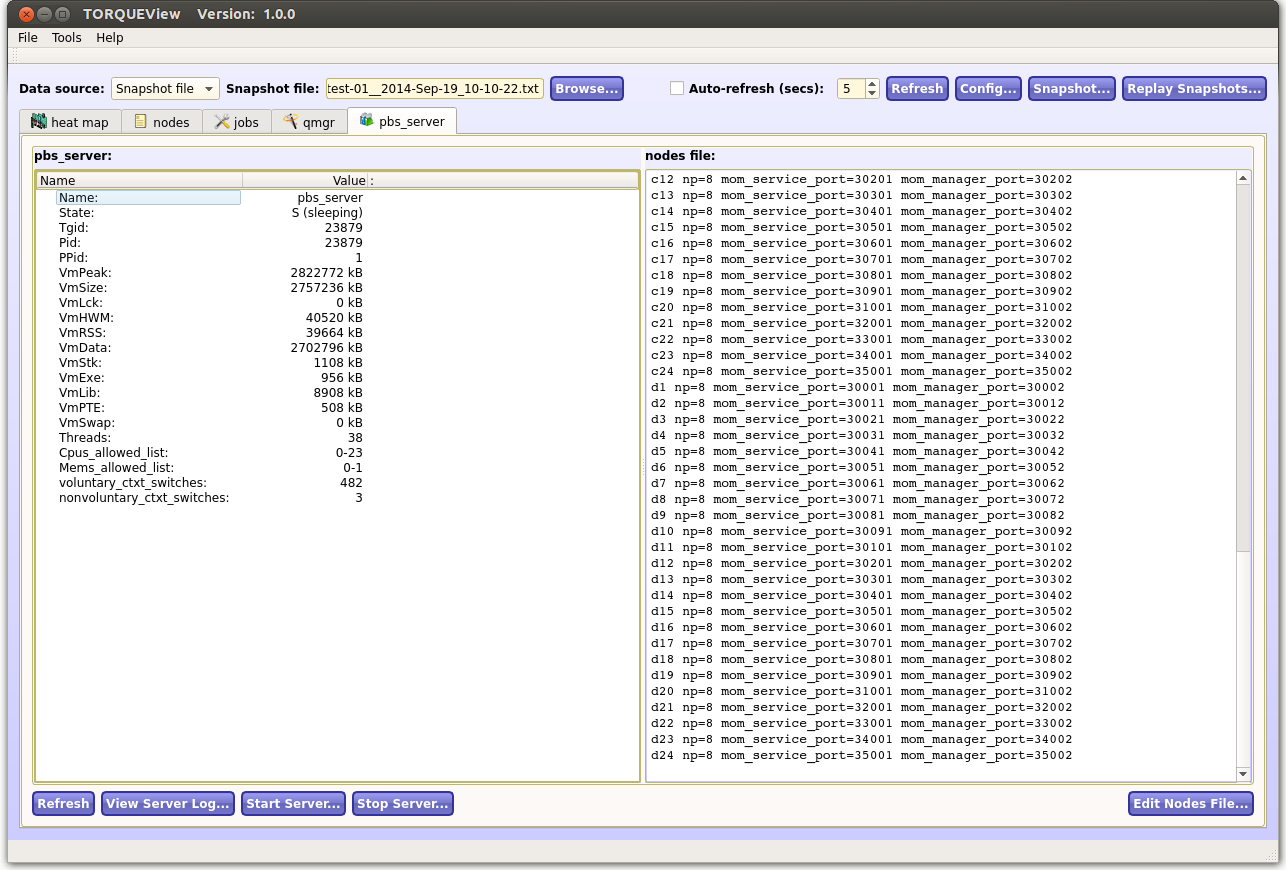
The pbs_server tab provides an interface to several pbs_server commands and shows their results.
On the right is a panel that shows the contents of the "nodes" file on the current host (either local or remote), which can be edited if desired by clicking the "Edit" button. NOTE: Since "nodes" files are so critical to cluster operation, TORQUEView will automatically create a backup of the current "nodes" file before overwriting it (the backup copy is located in the same directory, with a date/time stamp appended).
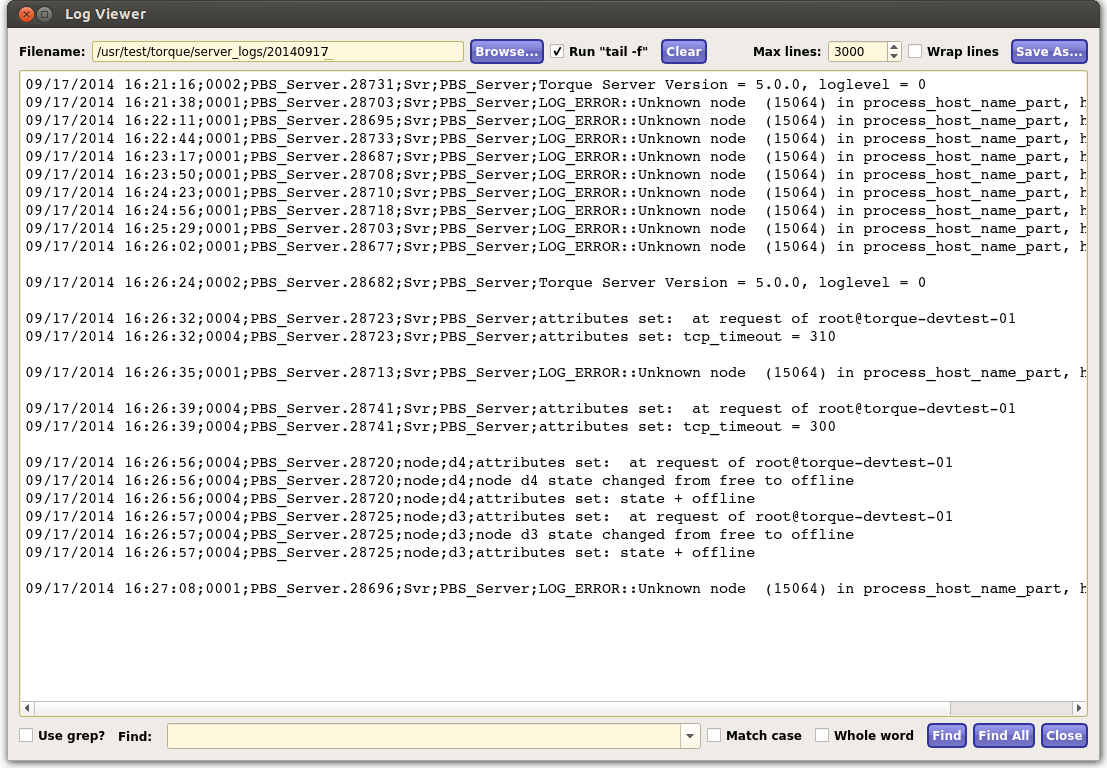
The pbs_server's "Log Viewer" button brings up a log viewer that lets you do a "tail -f" command on a log file you select. To start performing the "tail -f", click Start; to stop, click the Stop button. Contents of the log viewer's window can be saved to a file with the Save As button.
For searching, the Log Viewer lets you switch between a normal "Find" operation (on the contents of the log viewer window), or if you click the "Use grep" checkbox, it lets you indicate a grep pattern with options (this is done on the original file read in, not the contents of the window.)
