👋 Hi there! Deck is a product that helps Democratic campaigns run more efficient and effective programs.
Toward that end, we make predictions about which voters will turnout to vote in a given election, support a given candidate, make financial contributions, and more. We also use these predictions to predict a range of likely outcomes.
We plan to use this repo to share evaluations of our predictions. And this README will explain the files we've included.
- Forecast accuracy (
forecast-error.csv) - Score accuracy (
survey_validation_nc_2020.csv)
In forecast-error.csv, we share the forecasts we've published since 2019 alongside actual results and the absolute errors of our forecasts. Our forecasts' median absolute error has been 4% and 95% of our forecasts have fallen within our 95% confidence interval.
One common question we get is whether our forecasts are more accurate in larger districts. Our evaluation data shows us that district size is not a clear factor in our accuracy:
Median absolute forecast error by district size
| District type | Median absolute error |
|---|---|
| Statewide | 4.3% |
| US House | 4.3% |
| State Senate | 4.6% |
| State House | 3.8% |
However, there is a group of races where our forecasts clearly perform better: more competitive ones. For example, here's a breakdown of our median error by the size of the win margin:
| Margin size | Median absolute error |
|---|---|
| Less than 20% | 3.3% |
| 21% to 40% | 4.0% |
| More than 40% | 5.9% |
We believe this is because more of the context data our models rely on -- including media coverage and fundraising data -- is available in these races. Often, when our forecasts miss badly, it's because of a bug in the data we're applying our forecasting models to -- such as mislabled media data or mismatched finance data. If you see any interesting patterns while inspecting this evaluation data, please let us know!
More details on our blog:
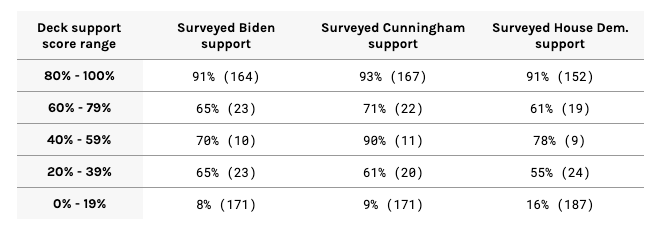
In survey_validation_nc_2020.csv, we share data from a validation exercise we did with data from a YouGov survey of voters in North Carolina re: who they would vote for in the 2020 contests for US President, US Senate, and US House.
Below, you can see which share of survey respondents in one of five Deck support score buckets indicated support for a given Democratic candidate. In most cases (except in very low sample size buckets, as indicated by the parenthetical), the share of survey respondents indicating support falls squarely within the expected Deck probability range.
We also took a look at how our scores predicting support for Cal Cunningham compared with survey-based Democratic Party support scores from another vendor. As shown in the area under the curve and gains charts below, we found that our scores were more precise.
Against the YouGov responses, our scores had an area under the curve of 0.96, mean squared error of 0.10, accuracy of 0.87, sensitivity of 0.91, and specificity of 0.84.
More details on our blog: