The purpose of this repository is to compare plotting libraries available for Java, especially in terms of speed and handling larger amounts of data. Tested libraries are following (feel free to suggest missing ones):
- Gral - release 0.10
- XChart - release 2.4.3
- JFreeChart - release 1.0.19
| Library | scatter 1k | scatter 10k |
|---|---|---|
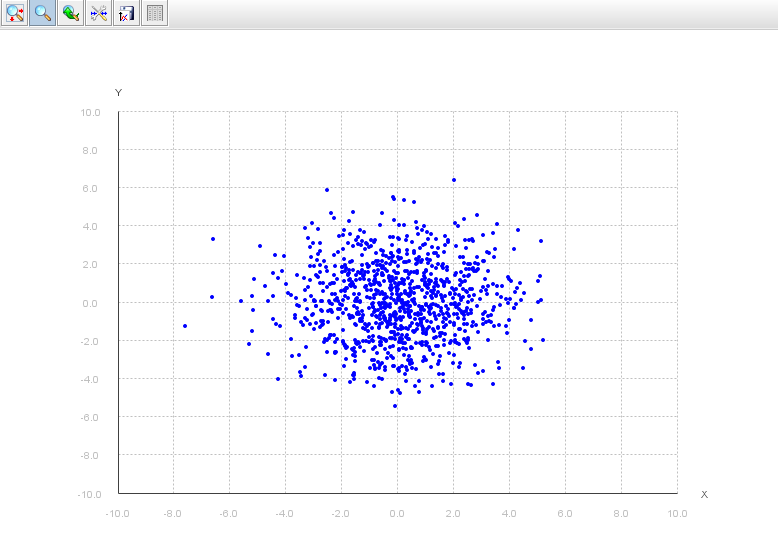
| Gral | 647ms/785ms | 867ms/1028ms |
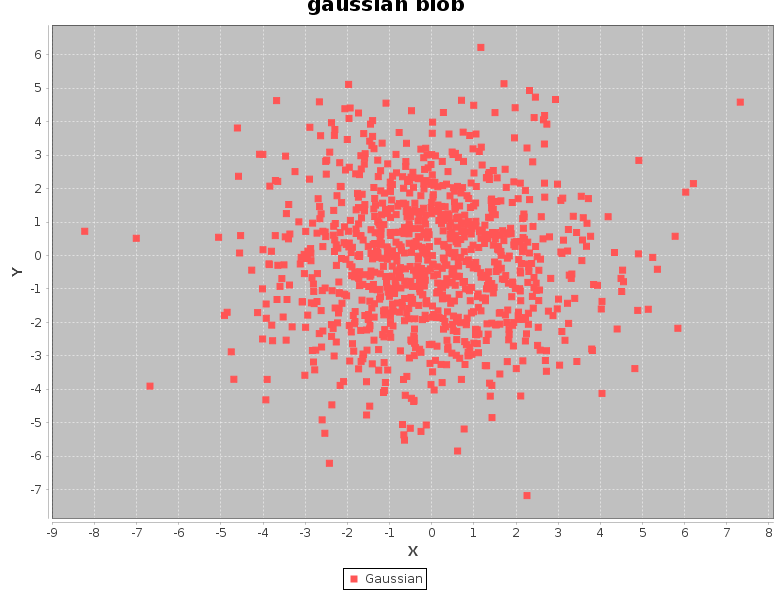
| JFree | 409ms/480ms | 471ms/522ms |
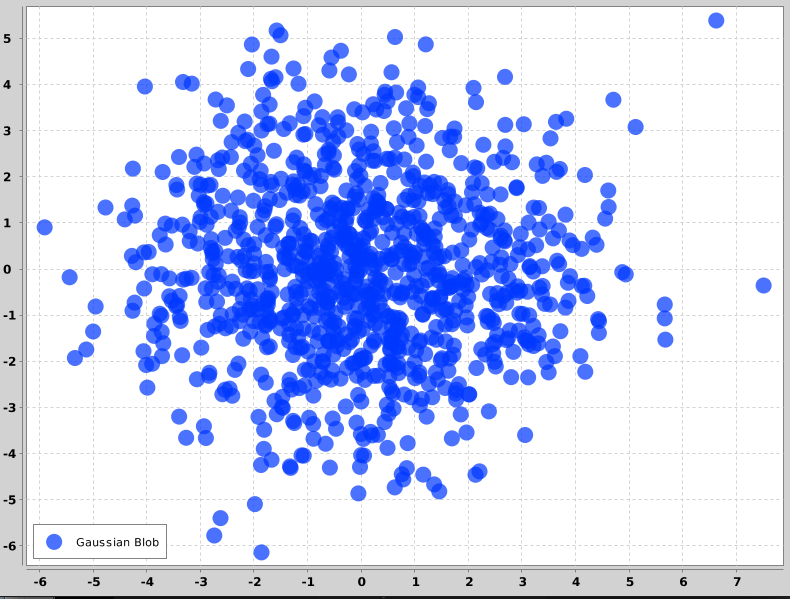
| XChart | 50ms/253ms | 103ms/313ms |
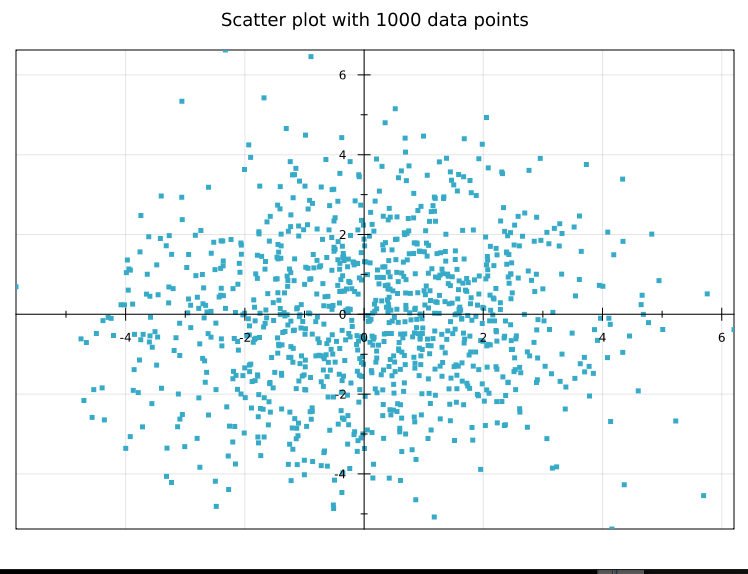
| JMathPlot | 450ms/507ms | 459ms/532ms |
First time is measured after initilization of plotting class, second one after displaying whole JFrame. This times could be very different on different platforms (and versions of Java). Time measurement is not exact and might slightly differ each run, the goal is just to get a rough approximation of rendering speed.
Source code Features:
- allows zooming
The library is not at Maven, I used a fork on github for testing.
Measured on Linux
- Oracle Java 8 (1.8.0_40)
- Intel i5 CPU 661 @ 3.33GHz (4 cores)
- Linux (kernel 3.2.0-77)