Coll2008
Data contributor: Lluís Coll, Catherine Potvin
Email: lluis.coll@ctfc.cat, catherine.potvin@mcgill.ca
Address:
- Forest Sciences Centre of Catalonia (CTFC), Ctra. Sant Llorenç de Morunys, km 2, 25280, Solsona, Spain
- Department of Biology, McGill University, Montreal, Quebec, Canada
Citation: Coll L, Potvin C, Messier C and Delagrange S (2008). 'Root architecture and allocation patterns of eight native tropical species with different successional status used in open-grown mixed plantations in Panama.' Trees - Structure and Function, 22(4), pp. 585-596.
DOI: 10.1007/s00468-008-0219-6
Abstract: We investigated biomass allocation and root architecture of eight tropical species with different successional status, as classified from the literature, along a size gradient up to 5 m. We focused on belowground development, which has received less attention than aboveground traits. A discriminant analysis based upon a combination of allocational and architectural traits clearly distinguished functional types and classified species according to successional status at a 100% success rate. For a given plant diameter, the pioneer species presented similar root biomass compared to the non-pioneer ones but higher cumulative root length and a higher number of root apices. A detailed study on the root system of a sub-sample of three species showed that the most late-successional species ( Tabebuia rosea ) had longer root internodes and a higher proportion of root biomass allocated to the taproot compared to the other two species ( Hura crepitans and Luehea seemannii ). Most pioneer species showed a higher leaf area ratio due to a higher specific leaf area ({SLA).} We conclude that the functional differences between pioneer and non-pioneer tree species found in natural forests were maintained in open-grown plantation conditions.
The dataset includes records for 35 individuals from 7 species belonging to 7 family(ies), presenting 1 functional type(s), growing in 1 condition(s) within 1 major type(s) of habitat, with data included for the following variables:
| Variable | Label | Units | N | Min | Median | Max |
|---|---|---|---|---|---|---|
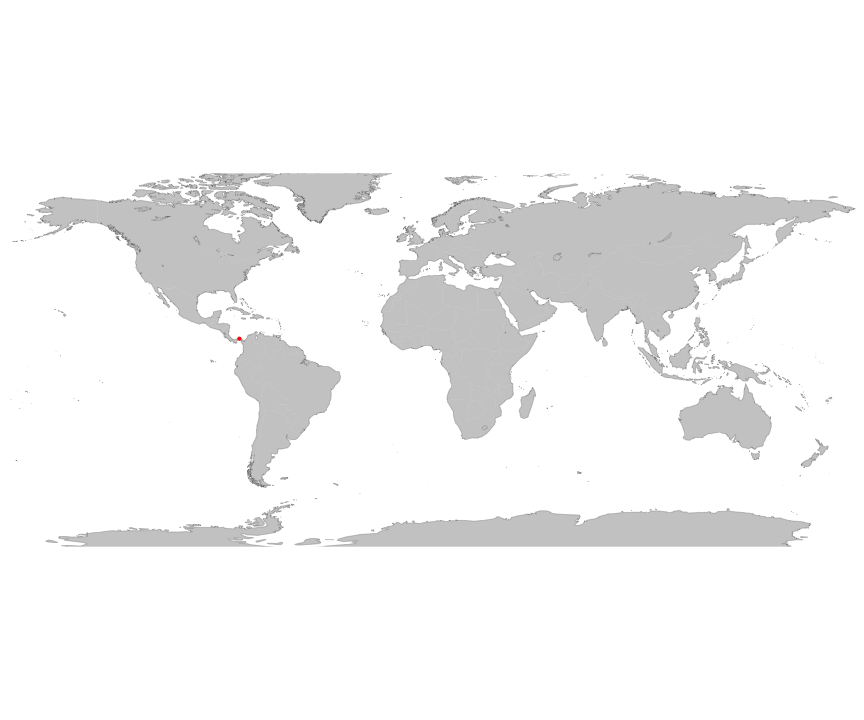
| latitude | Latitude | deg | 35 | 9.3 | 9.3 | 9.3 |
| longitude | Longitude | deg | 35 | -79 | -79 | -79 |
| age | Age | yr | 35 | 3 | 3 | 3 |
| a.lf | Leaf area | m2 | 35 | 0.0071 | 5.5 | 185 |
| a.stba | Stem area at base | m2 | 35 | 0.000038 | 0.002 | 0.039 |
| h.t | Height | m | 35 | 0.36 | 2.1 | 4.8 |
| d.ba | Basal diameter | m | 35 | 0.007 | 0.05 | 0.22 |
| m.lf | Leaf mass | kg | 35 | 0.001 | 0.47 | 15 |
| m.st | Total stem mass | kg | 35 | 0.015 | 2.7 | 49 |
| m.so | Aboveground mass | kg | 35 | 0.017 | 3.6 | 56 |
| m.br | Branch mass | kg | 35 | 0 | 0.36 | 20 |
| m.rt | Total root mass | kg | 35 | 0.0045 | 1.1 | 15 |
| m.to | Total mass | kg | 35 | 0.021 | 4 | 71 |
| ma.ilf | Leaf mass per area | kg m-2 | 35 | 0.067 | 0.093 | 0.14 |
And locally within the country:

The sites sampled are:
| Location | Longitude | Latitude | Vegetation |
|---|---|---|---|
| Sardinilla, Bue Vista region, Pama | -79.05222 | 9.325 | Tropical seasonal forest |
The growing conditions of sampled plants was:
| Location | growingCondition |
|---|---|
| Sardinilla, Bue Vista region, Pama | plantation managed |
| Species | Family | Pft |
|---|---|---|
| Antirrhoea trichantha | Rubiaceae | deciduous angiosperm |
| Cedrela odorata | Meliaceae | deciduous angiosperm |
| Cordia alliodora | Boraginaceae | deciduous angiosperm |
| Hura crepitans | Euphorbiaceae | deciduous angiosperm |
| Luehea seemannii | Tiliaceae | deciduous angiosperm |
| Sterculia apetala | Malvaceae | deciduous angiosperm |
| Tabebuia rosea | Bignonaceae | deciduous angiosperm |
Sampling strategy: In August 2001, intensive allometric measurements were initiated. Saplings/trees from each of the eight species were grouped in five size class categories based on their height. The height range for each species in July 2001 was as follows: Luehea (0.56-4.42 m), Cordia (1.9-3.32 m), Sterculia (0.58-5.15 m), Antirrhoea (0.57-2.77 m), Enterolobium (1.66-2.48 m), Cedrela (0.56-3.57 m), Tabebuia (0.37-3.18 m) and Hura (0.76-4.85 m). Care was taken to sample a similar height range from all species. Differences in total height among individuals were caused by differences in growth caused by micro-scale variations in topography. All sampled individuals were healthy. Within each size category, one individual per species was randomly selected for allometric and biomass measurements. Sample size was thus five trees per species for a total of forty saplings. Each of the experimental saplings was harvested and the root system excavated and the following traits were measured: (1) diameter at 10 cm from the ground; (2) height; (3) number, length and biomass of branches;(4) trunk biomass and (5) root biomass. All leaves from the saplings were harvested and dried to provide total leaf biomass.
Leaf area: Specific leaf area (SLA) calculated from another study (Delagrange et al. 2008) was used to scale up biomass of leaves to total leaf area per tree. SLA values were obtained from fifteen to twenty-five leaves per species where the leaf area had been measured with a leaf area meter (Li-Cor 3100) before being dried and weighed.
Stem cross sectional area: Stem diameter was measured at 10cm from the soil surface.
Height: Height was measured on each individual.
Biomass: Dry mass of all material.
Traits: specific leaf area.
Other variables: branch biomass (g), total leaf biomass (g), total aboveground biomass (g), total belowground biomass (g), total plant biomass (g), stem.biomass (g)
Year collected: 2001
Acknowledgements: J. Monteza for supervising and motivating the team of workers digging roots in the wet, clay rich soils of Sardinilla, Panama
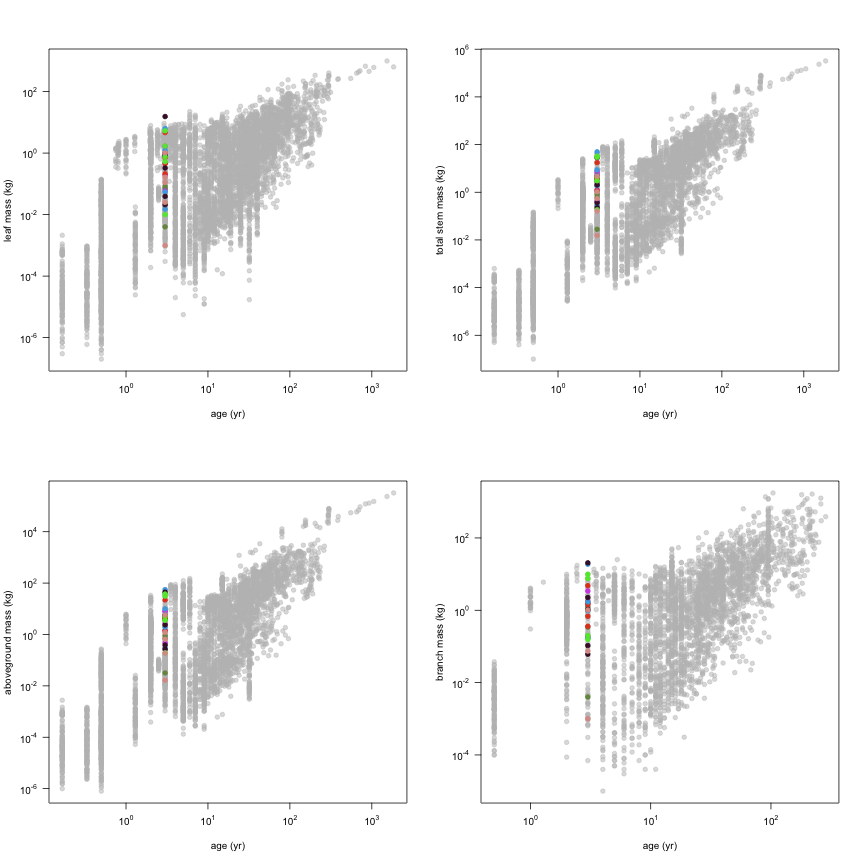
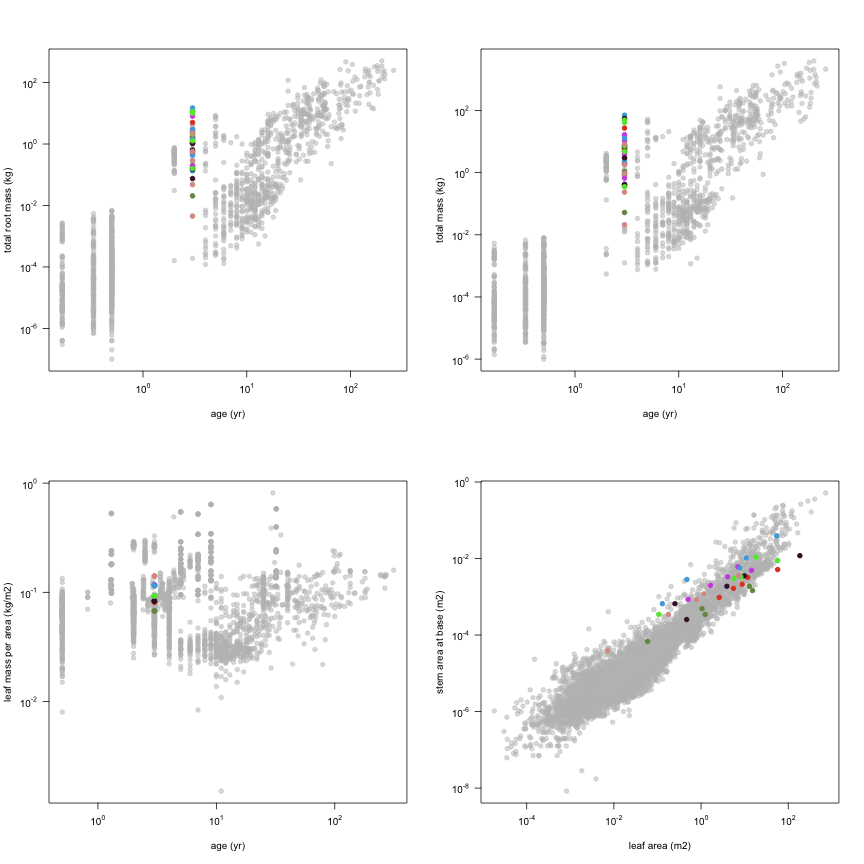
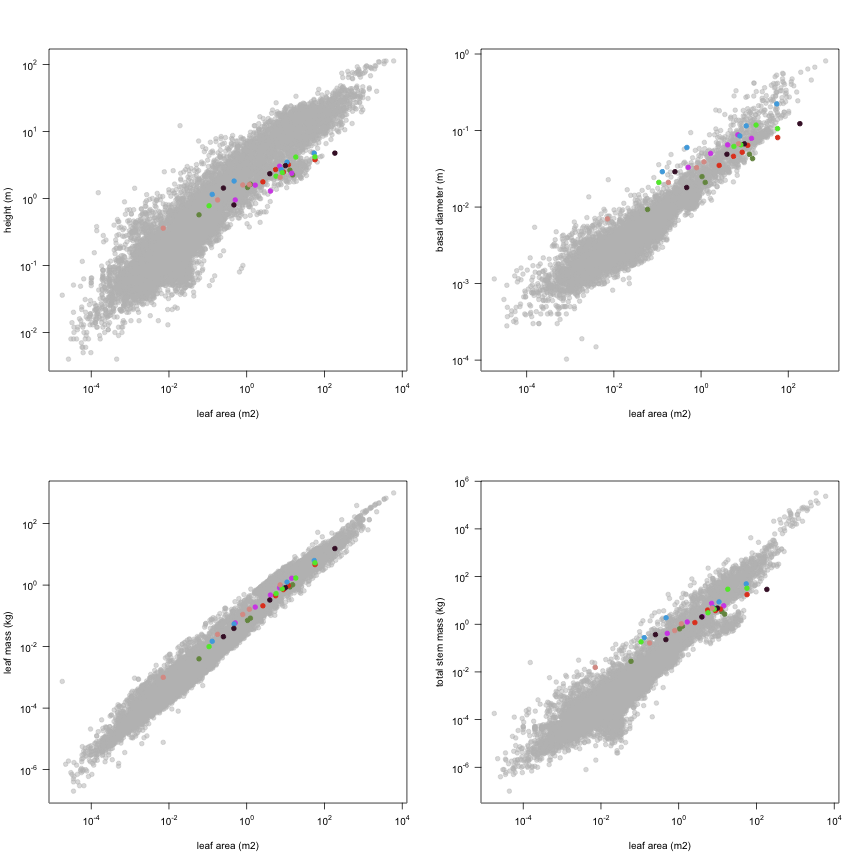
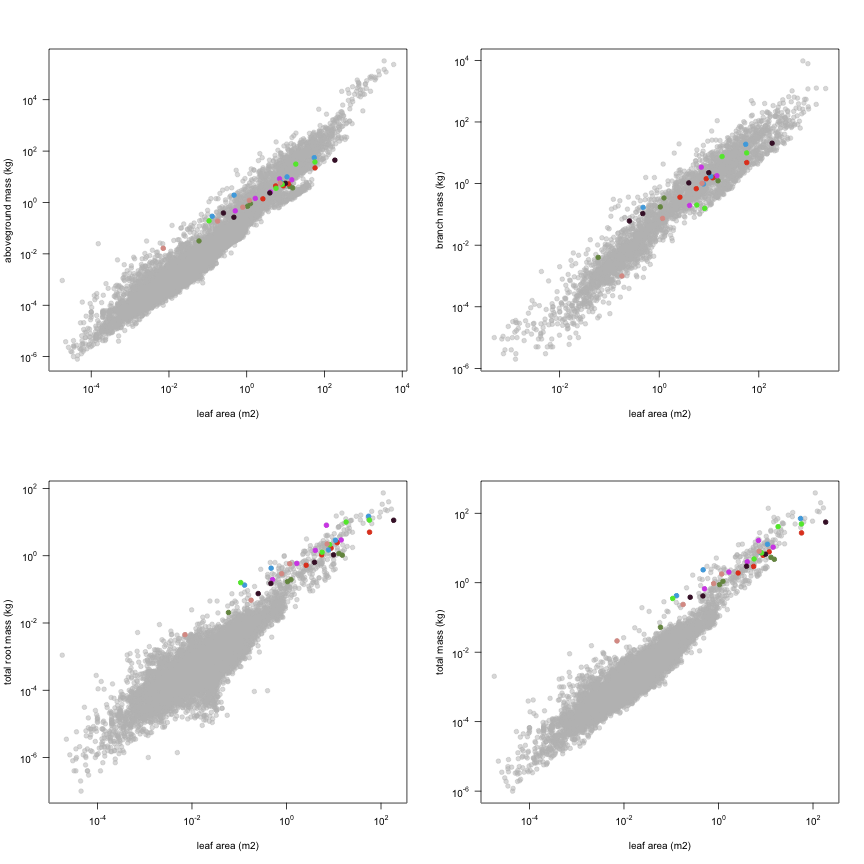
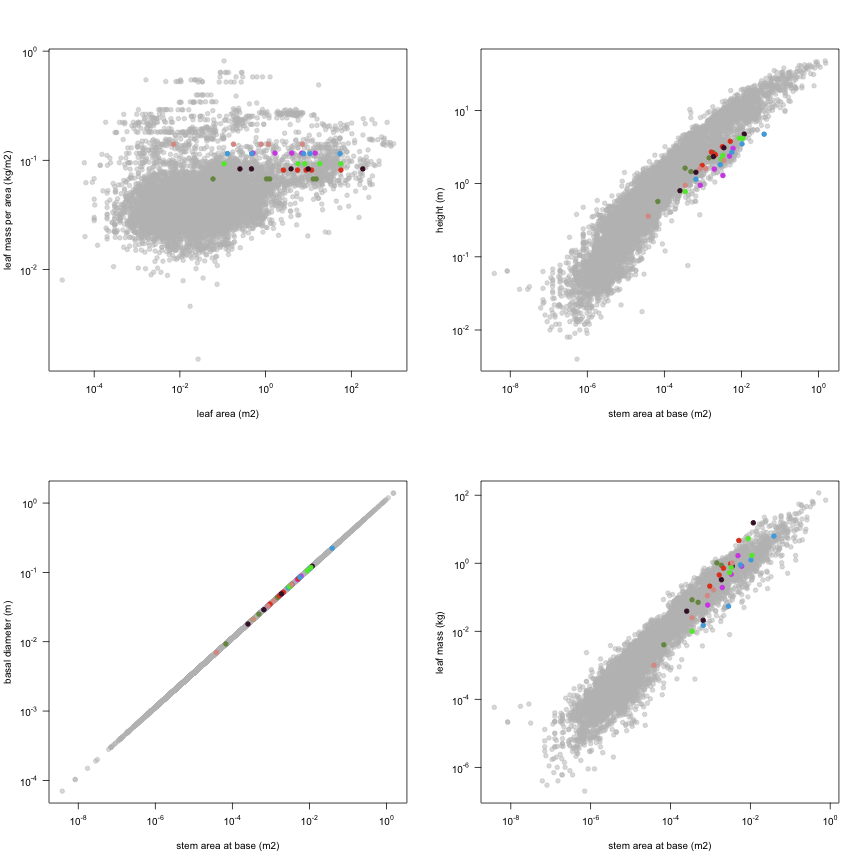
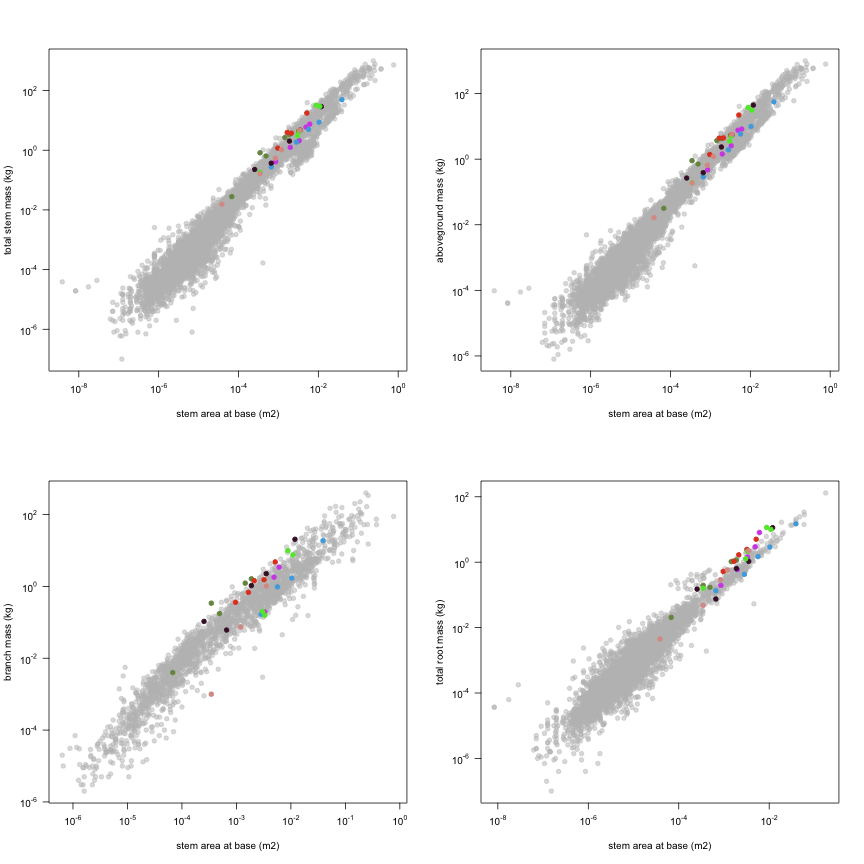
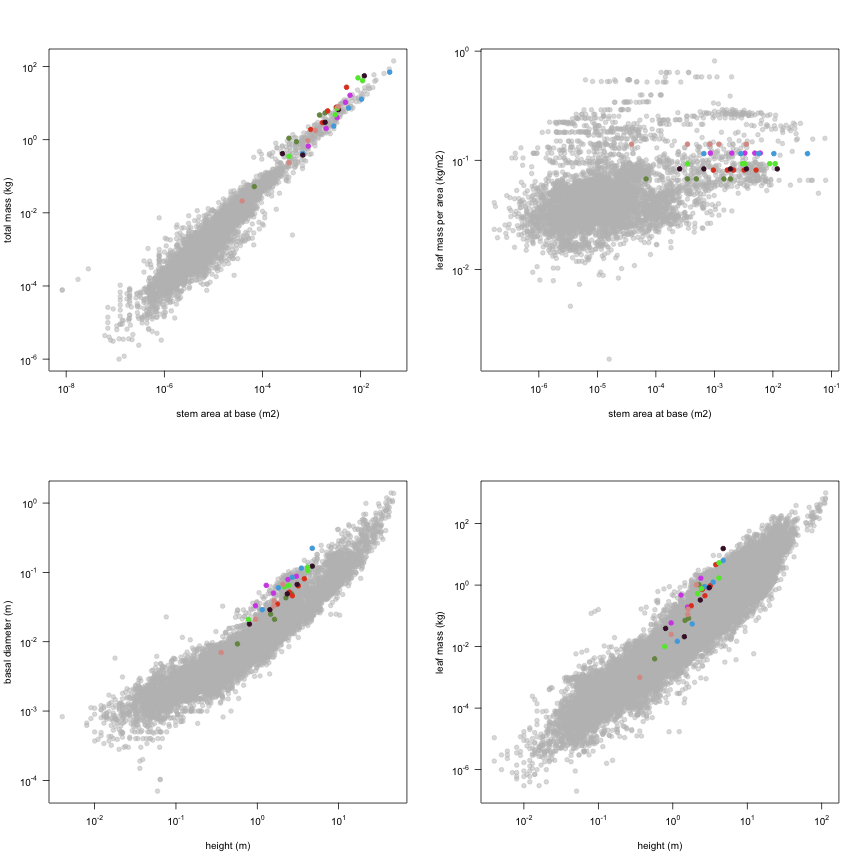
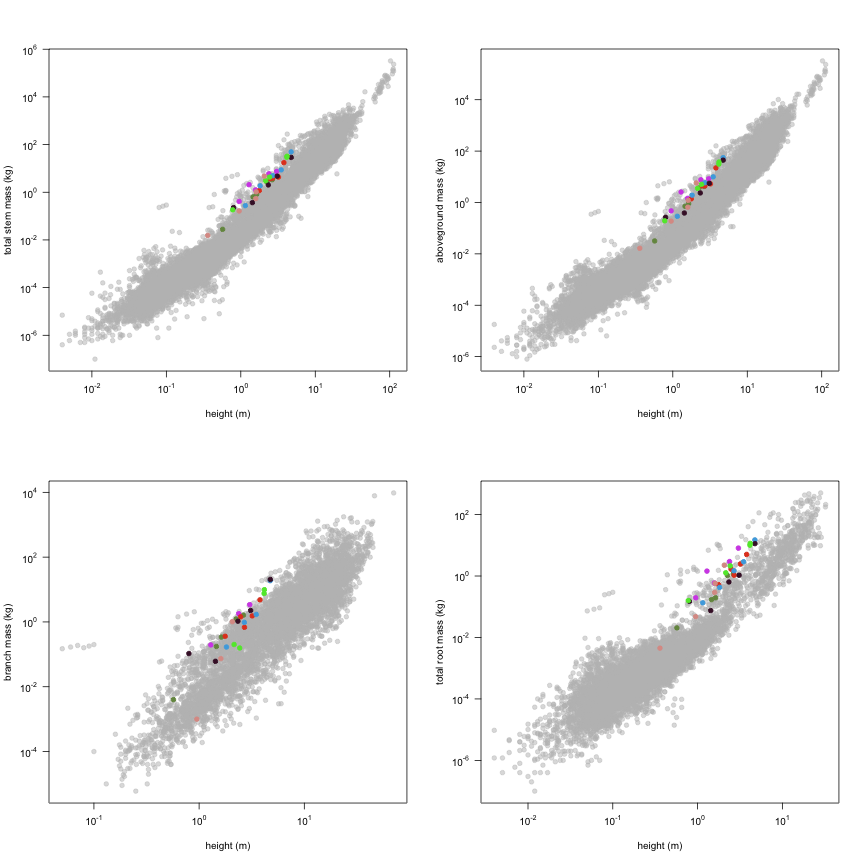
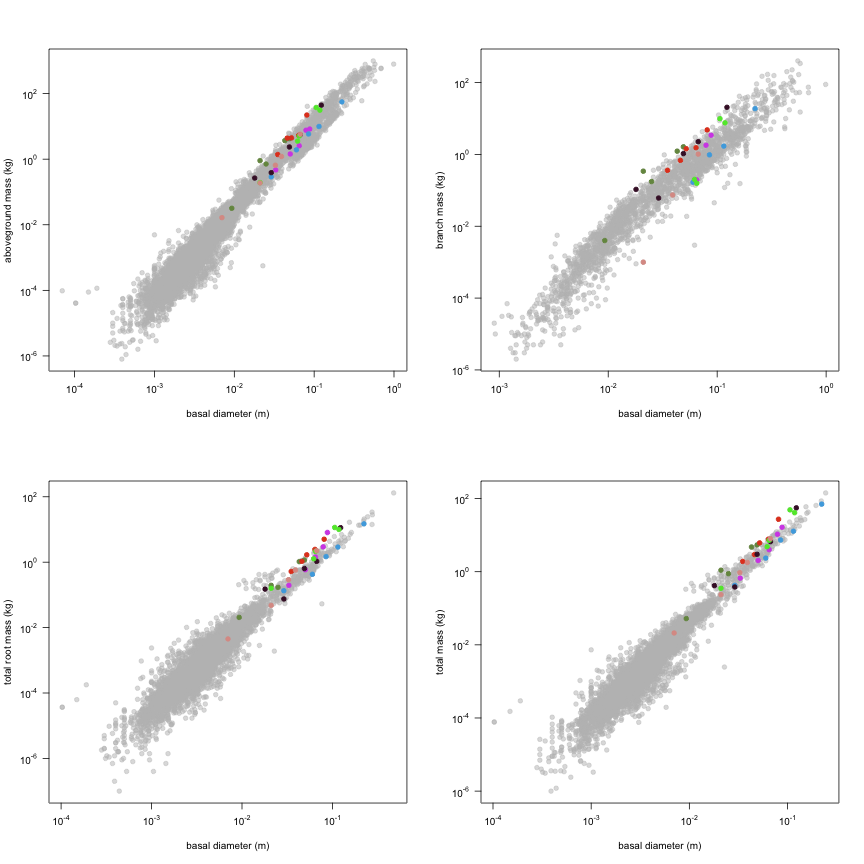
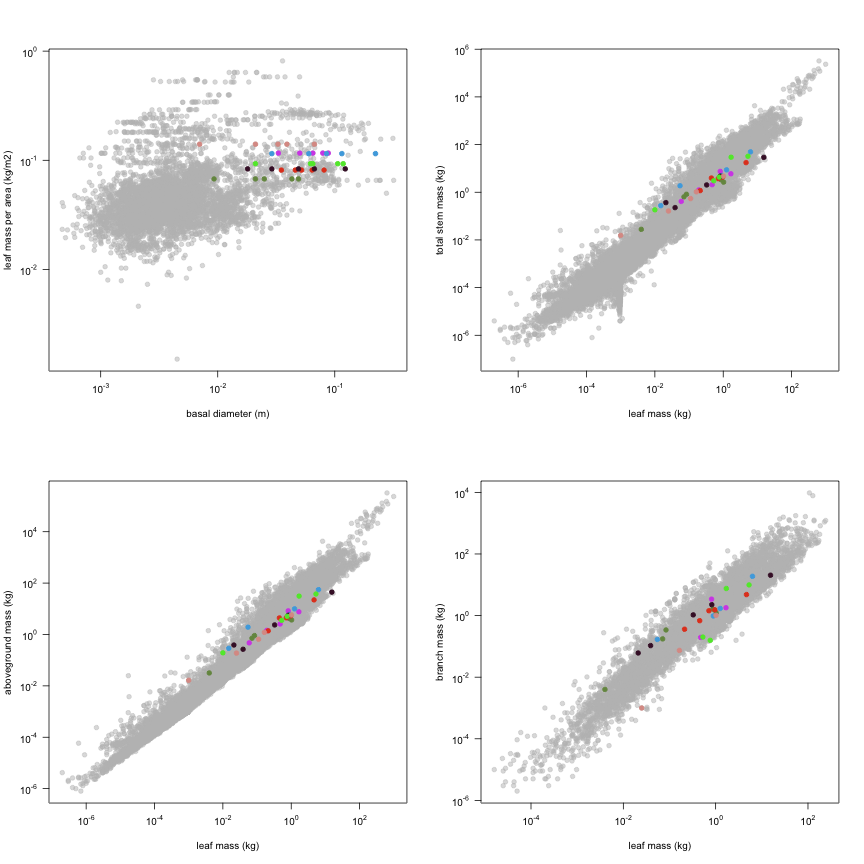
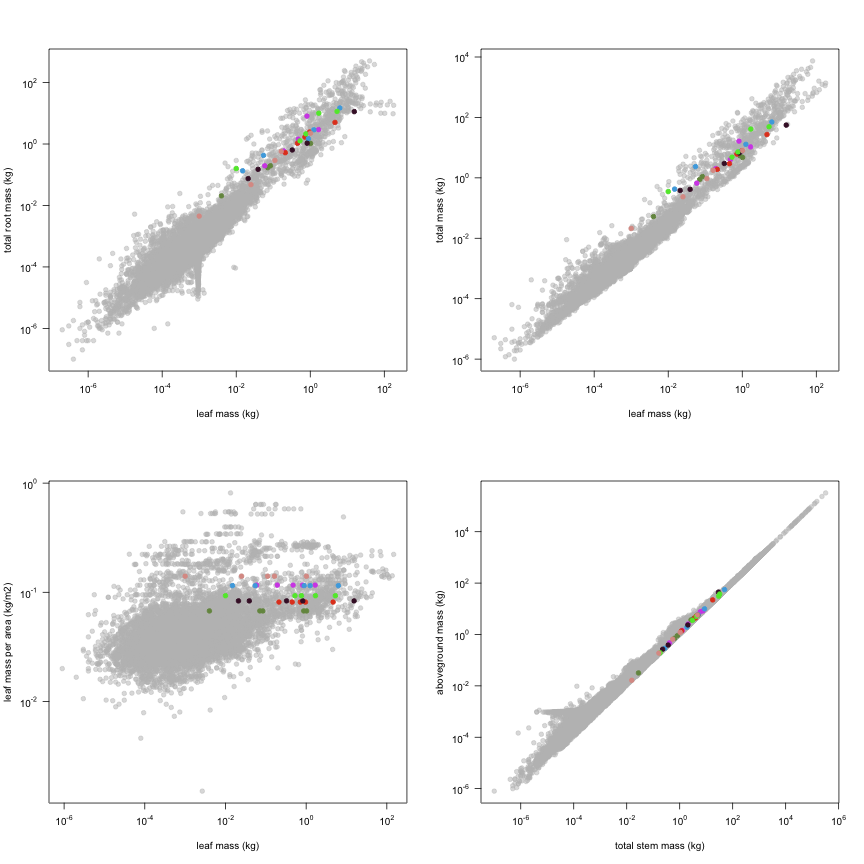
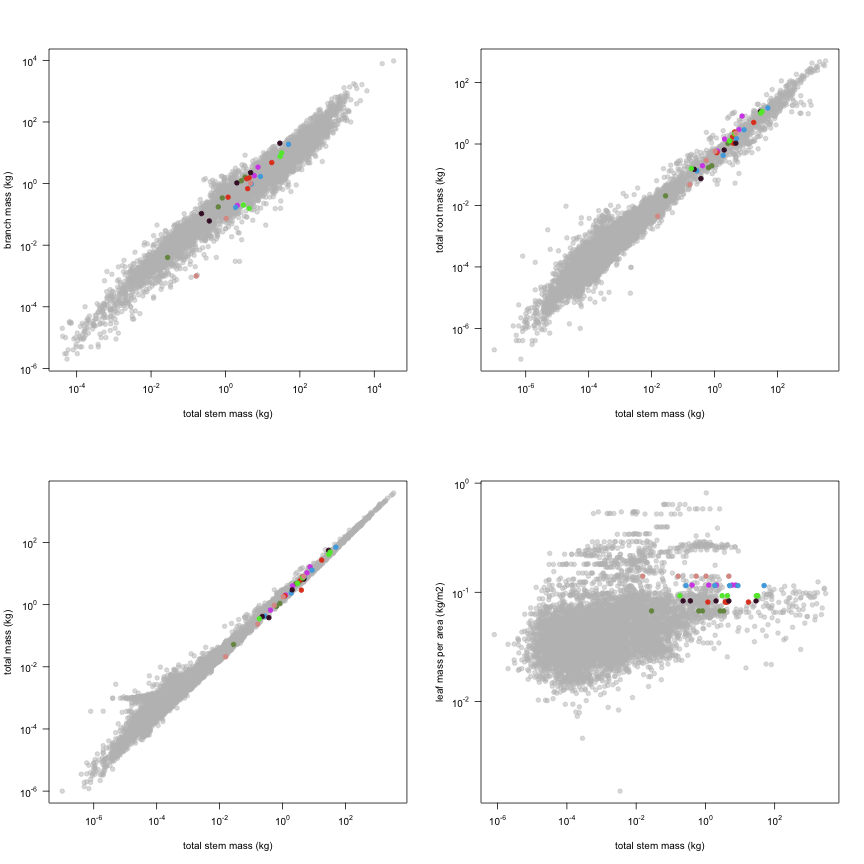
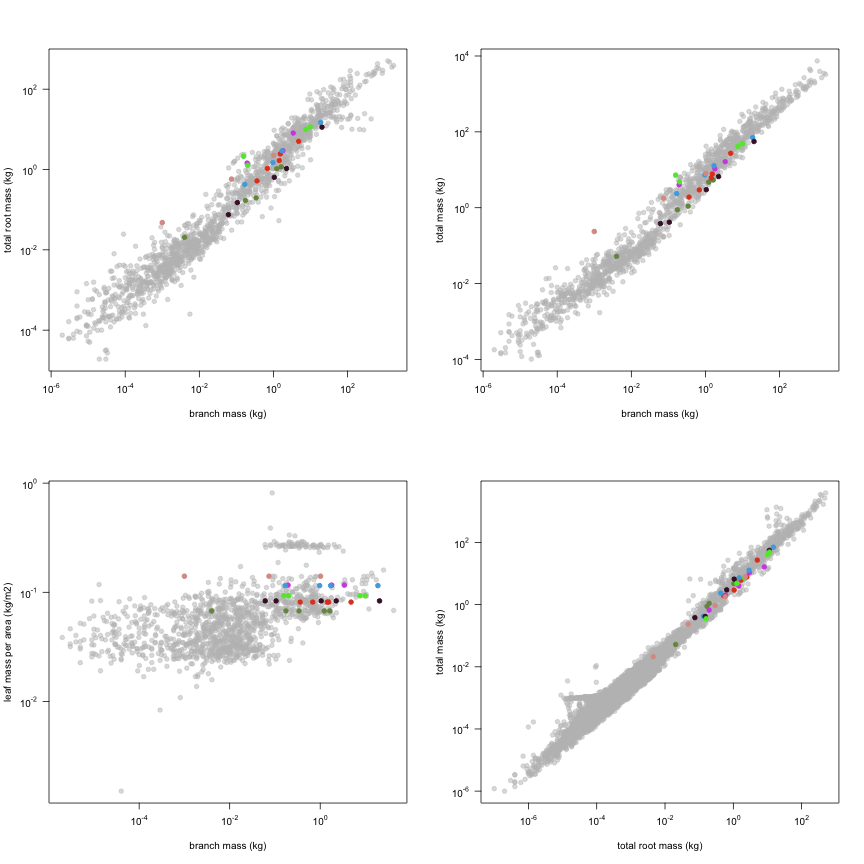
This is how the study Coll2008 fits in the entire dataset (grey). each colour represents a species. A legend of species names with colours is included at the end for reports with 1 < n < 20 species.