Kohyama1990
Data contributor: Takashi Kohyama
Email: kohyama@ees.hokudai.ac.jp
Address:
- Faculty of Environmental Earth Science, Hokkaido University, Kita-ku, Sapporo 060-0810, Japan
Citation: Kohyama T and Hotta M (1990). 'Significance of allometry in tropical saplings.' Functional Ecology, 4(4), pp. 515-521.
DOI: 10.2307/2389319
Abstract: Differences in allometric relationships of understorey saplings (60-300 cm tall) between nine common shade-tolerant species of subcanopy, canopy and emergent trees were examined in an old-growth foothill rain forest in West Sumatra, Indonesia. Interspecific variation was found in the intercept of the regression line between logarithmic dimensions but not in the slope. Detected interspecific differences could be interpreted as a result of a trade-off between height growth (for future exploitation of better-lit conditions at higher levels in the canopy) and leaf area extension (for current exploitation of poor light nearer the base of the canopy). Saplings of emergent Swintonia schwenkii Teijsm. & Binn. ex Hook. f. favoured height growth rather than expansion of assimilative area. Trends of interspecific differences in sapling allometry in tropical rain forest were similar to those in warm-temperate rain forest. Tropical saplings had more slender trunks and greater total leaf area at a given height than warm-temperate saplings, but dry weight proportions among organs were similar. We hypothesize that the advantage of maintaining assimilative area in present height is diminished in a habitat with higher growth rate and/or steeper vertical light gradient such as in tropical forest.
The dataset includes records for 79 individuals from 9 species belonging to 8 family(ies), presenting 1 functional type(s), growing in 1 condition(s) within 1 major type(s) of habitat, with data included for the following variables:
| Variable | Label | Units | N | Min | Median | Max |
|---|---|---|---|---|---|---|
| latitude | Latitude | deg | 79 | -0.92 | -0.92 | -0.92 |
| longitude | Longitude | deg | 79 | 100 | 100 | 100 |
| a.lf | Leaf area | m2 | 79 | 0.035 | 0.26 | 1.8 |
| a.stbh | Stem area at breast height | m2 | 79 | 0.000015 | 0.000072 | 0.00031 |
| a.cp | Crown area | m2 | 79 | 0.078 | 0.48 | 2.4 |
| h.t | Height | m | 79 | 0.59 | 1.4 | 3 |
| h.c | Height to crown base | m | 79 | 0 | 0.57 | 1.4 |
| d.bh | Dbh | m | 79 | 0.0043 | 0.0096 | 0.02 |
| h.bh | Height of d.bh measurement | m | 79 | 0.059 | 0.14 | 0.3 |
| d.cr | Crown width | m | 79 | 0.31 | 0.78 | 1.7 |
| c.d | Crown depth | m | 79 | 0.19 | 0.79 | 2.2 |
| m.lf | Leaf mass | kg | 79 | 0.0019 | 0.015 | 0.087 |
| m.st | Total stem mass | kg | 79 | 0.0047 | 0.037 | 0.36 |
| m.so | Aboveground mass | kg | 79 | 0.0076 | 0.053 | 0.44 |
| m.br | Branch mass | kg | 79 | 0 | 0.0058 | 0.072 |
| ma.ilf | Leaf mass per area | kg m-2 | 79 | 0.038 | 0.056 | 0.079 |
And locally within the country:

The sites sampled are:
| Location | Longitude | Latitude | Vegetation |
|---|---|---|---|
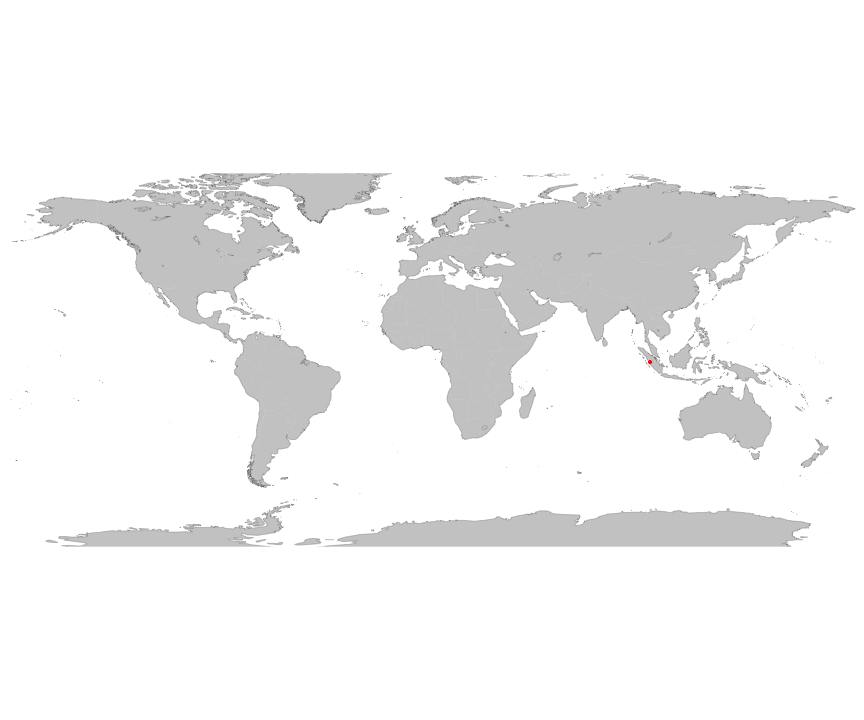
| Ulu Gadut valley, Padang, Sumatra, Indonesia | 100.5 | -0.9166667 | Tropical rainforest |
The growing conditions of sampled plants was:
| Location | Grouping | growingCondition |
|---|---|---|
| Ulu Gadut valley, Padang, Sumatra, Indonesia | Year = 1987 | field wild |
| Ulu Gadut valley, Padang, Sumatra, Indonesia | Year = 1984 | field wild |
| Species | Family | Pft |
|---|---|---|
| Diospyrus sumatrana | Ebenaceae | evergreen angiosperm |
| Gonystylus forbesii | Thymelaeaceae | evergreen angiosperm |
| Grewia florida | Tiliaceae | evergreen angiosperm |
| Hopea dryobalanoides | Dipterocarpaceae | evergreen angiosperm |
| Mastixia trichotoma | Cornaceae | evergreen angiosperm |
| Nephelium juglandifolium | Sapindaceae | evergreen angiosperm |
| Cleistanthus glandulosus | Euphorbiaceae | evergreen angiosperm |
| Shorea sumatrana | Dipterocarpaceae | evergreen angiosperm |
| Swintonia schwenkii | Anacardiaceae | evergreen angiosperm |
Sampling strategy: Abundant/representing species with high sapling(seedling) density under closed canopy were selected, based on the permanent plot censuses in primary forest. Chosen individuals were apparently seed origin and without obvious sign of past stem breakage.
Leaf area: The outline of the entire leaf(let)-brade (excluding petiole/rachis) was traced by thin tracing paper. The traced leaf brades were cut, weighed, and converted to area from unit-area weight of used paper.
Stem cross sectional area: Two perpendicular diameters were measured for the main stem at 1/10 of top height using a calliper, and cross-section area was obtained as that of ellipsoid with two diameters.
Height: the vertical distance from the base on soil surface to the highest leaf, measured by a pole or a convex steal measure tape.
Crown area: Two horizontal widths of crowns were obtained with a convex steel measure tape. The maximum width was obtained first, and the other was the maximum one along the perpendicular angle to the first one. Crown projection area was calculated from these two widths as an ellipsoid area.
Biomass: Entire samples were put into electric oven at 80degC over a couple of days to yield oven-dry weight, measured with an electric balance.
Growth environment: All samples were from fully closed-canopy stands, or they were not grown under canopy gaps. Tropical foothill rain forest.
Year collected: 1984, 1987
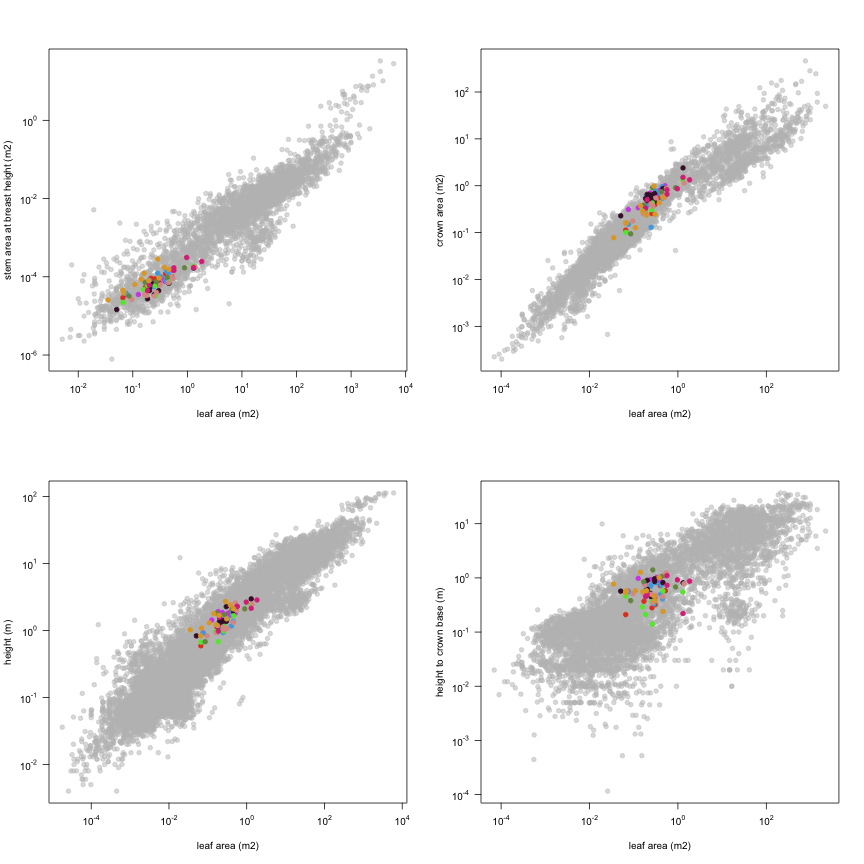
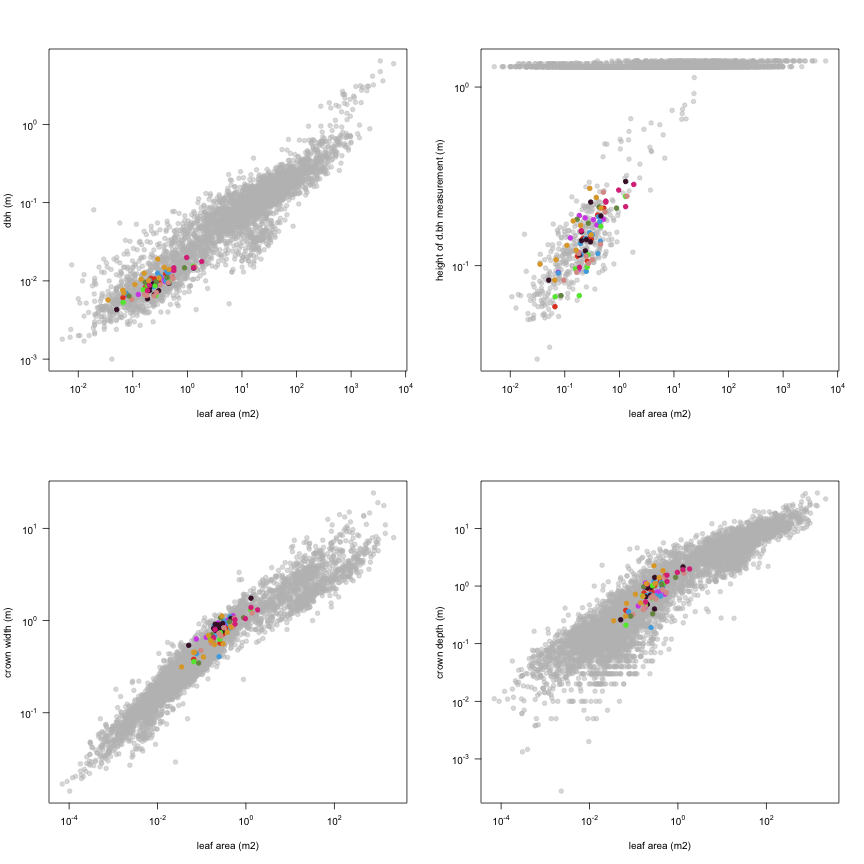
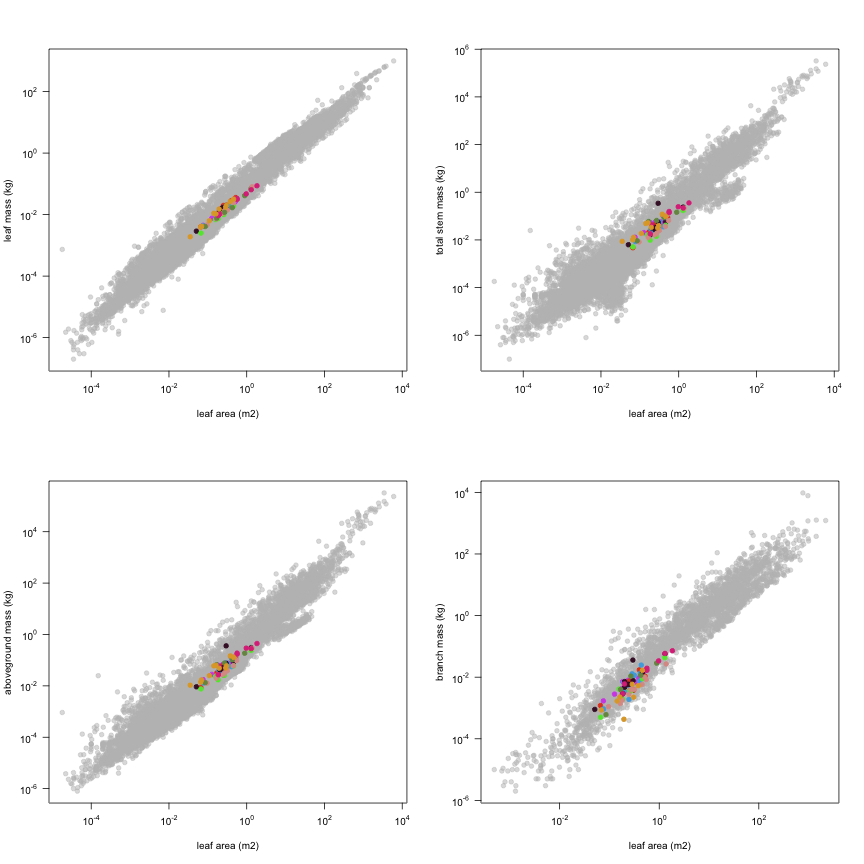
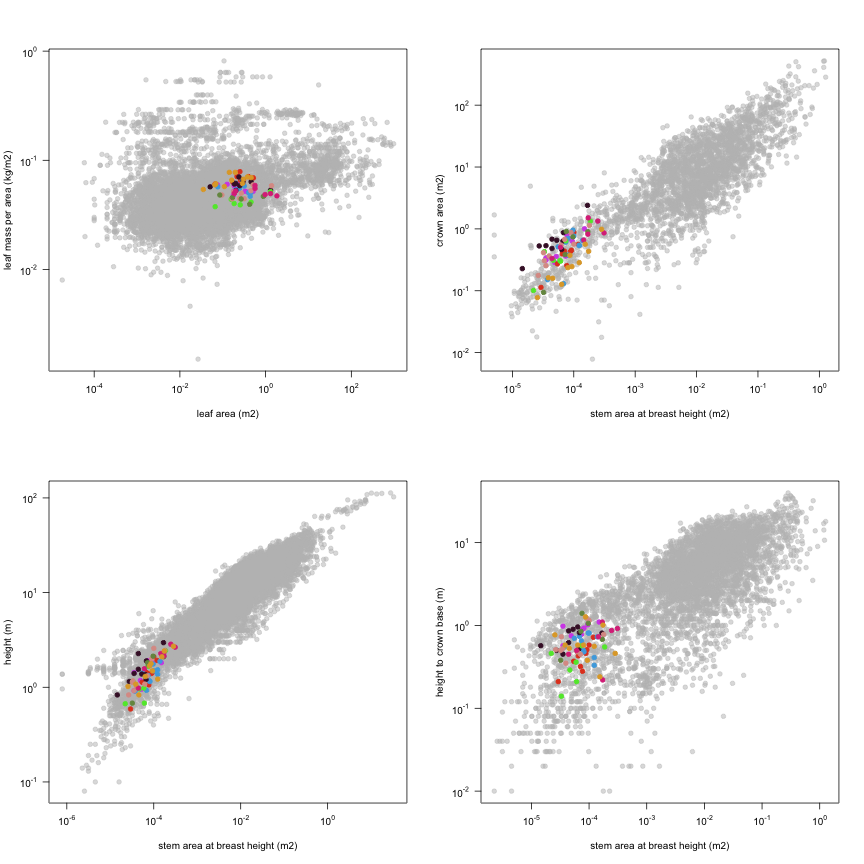
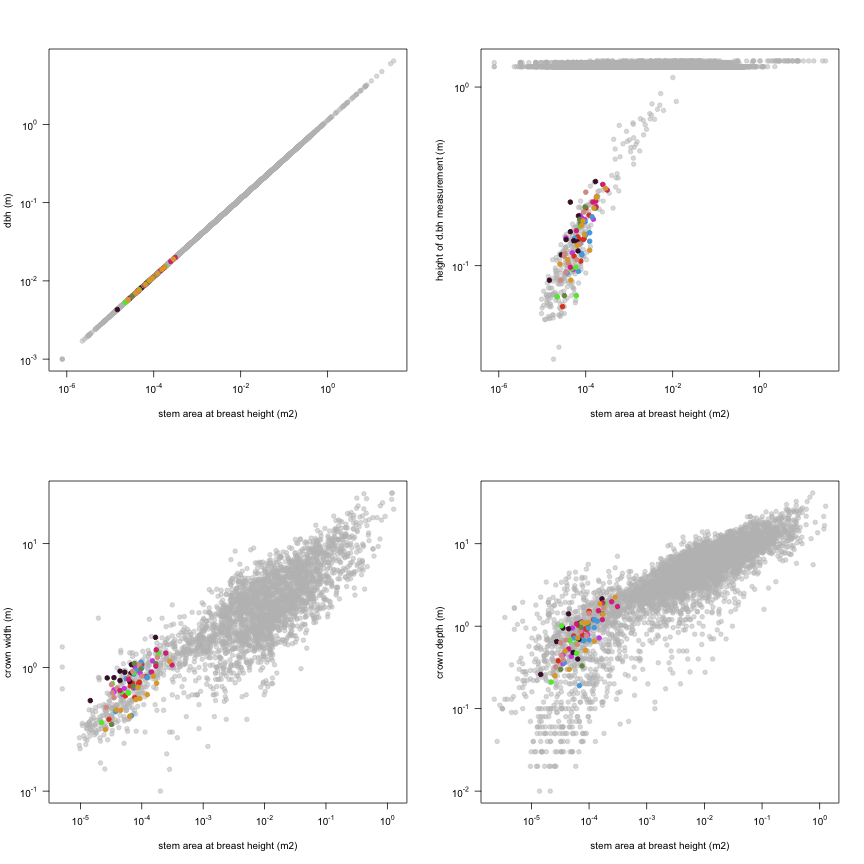
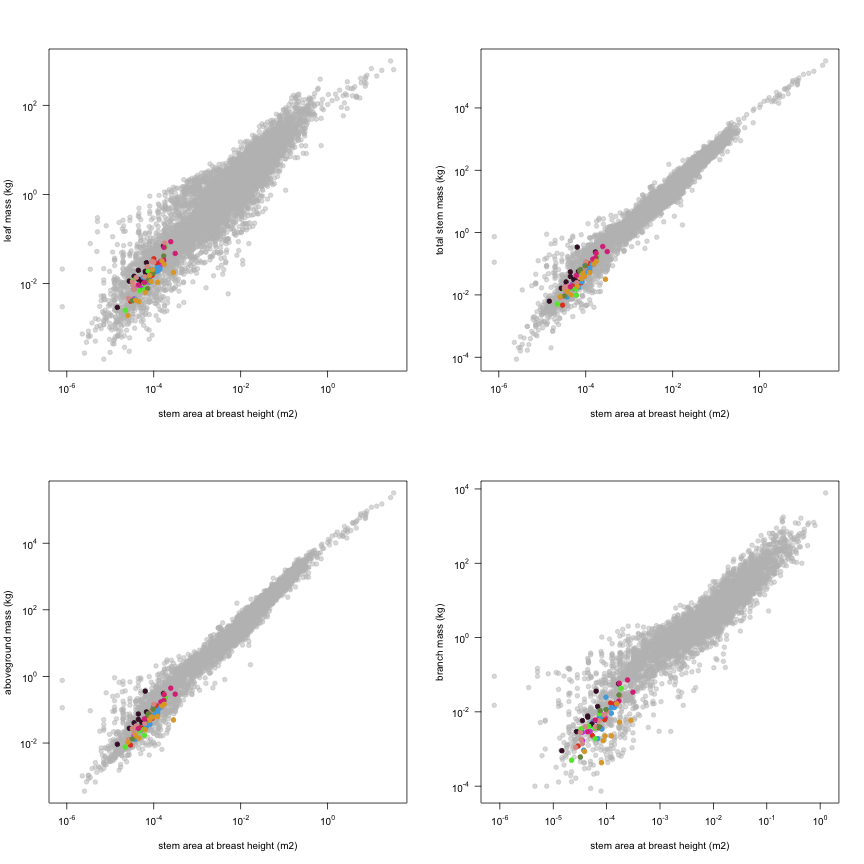
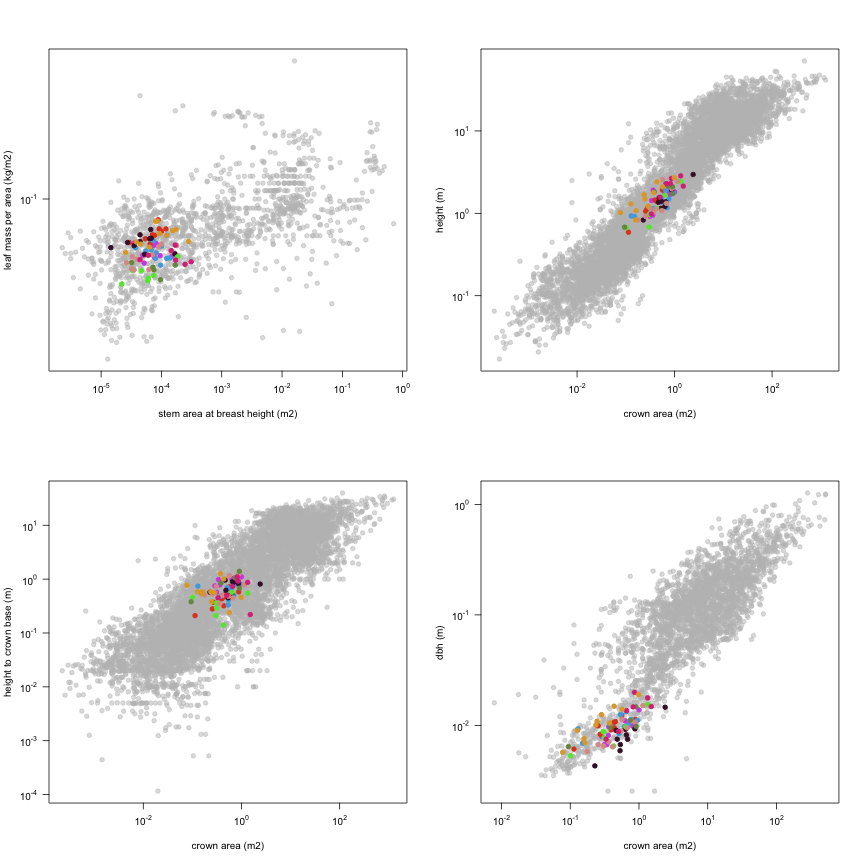
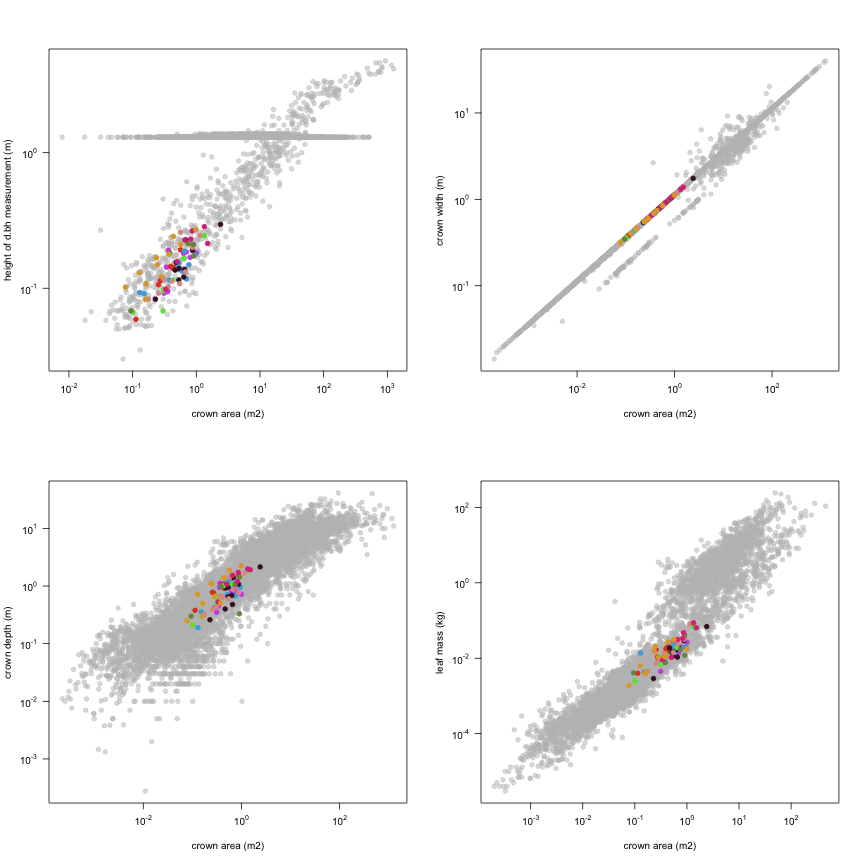
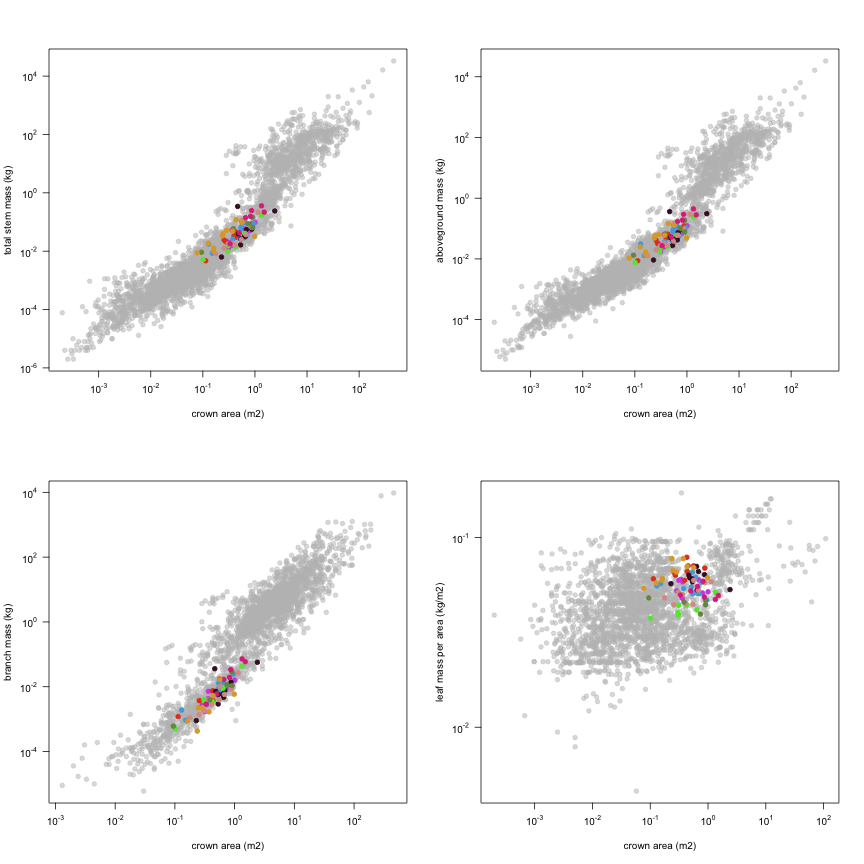
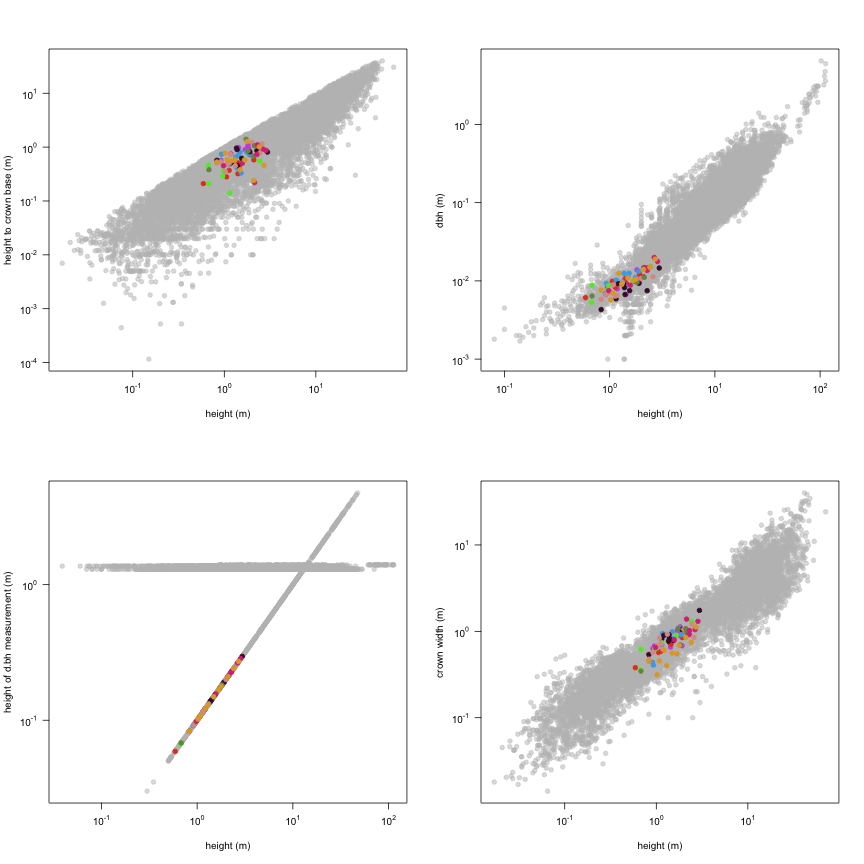
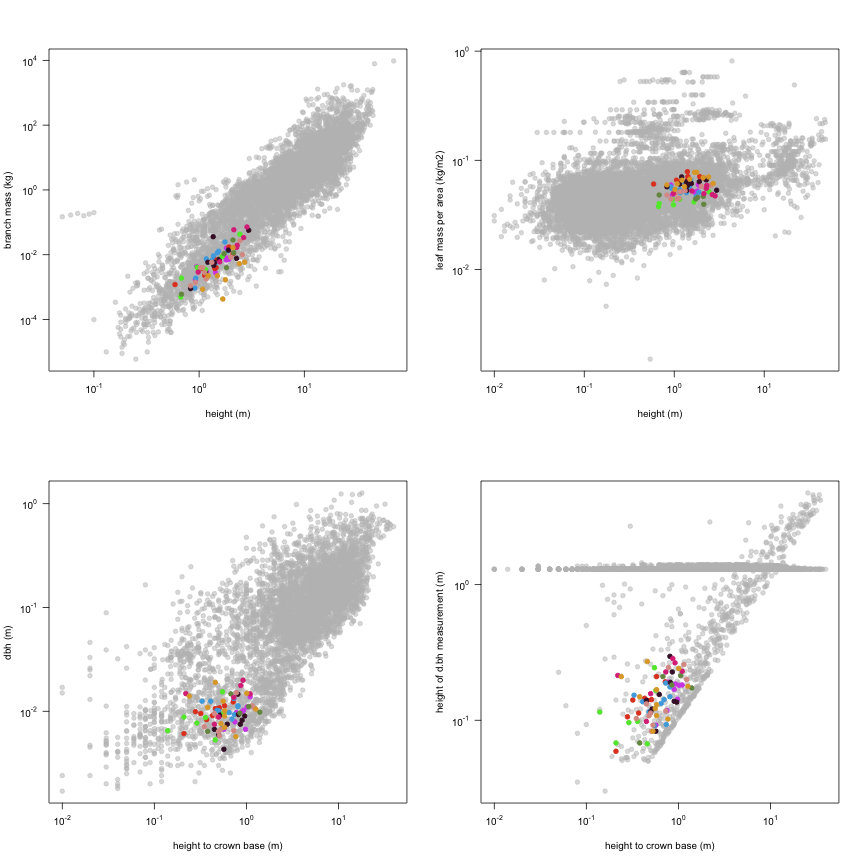
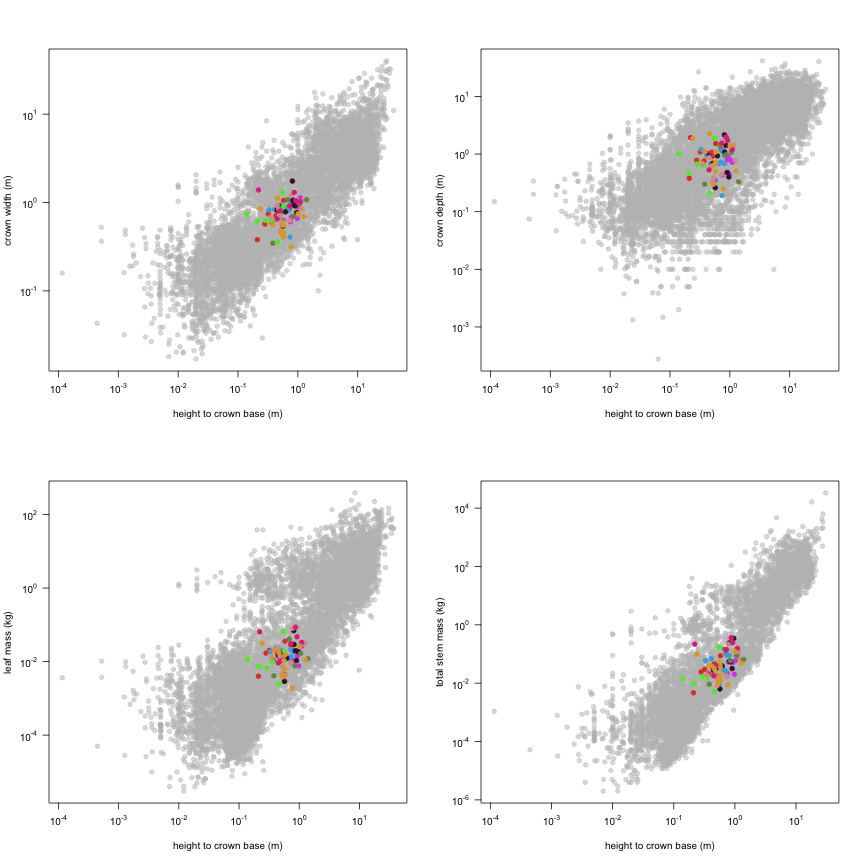
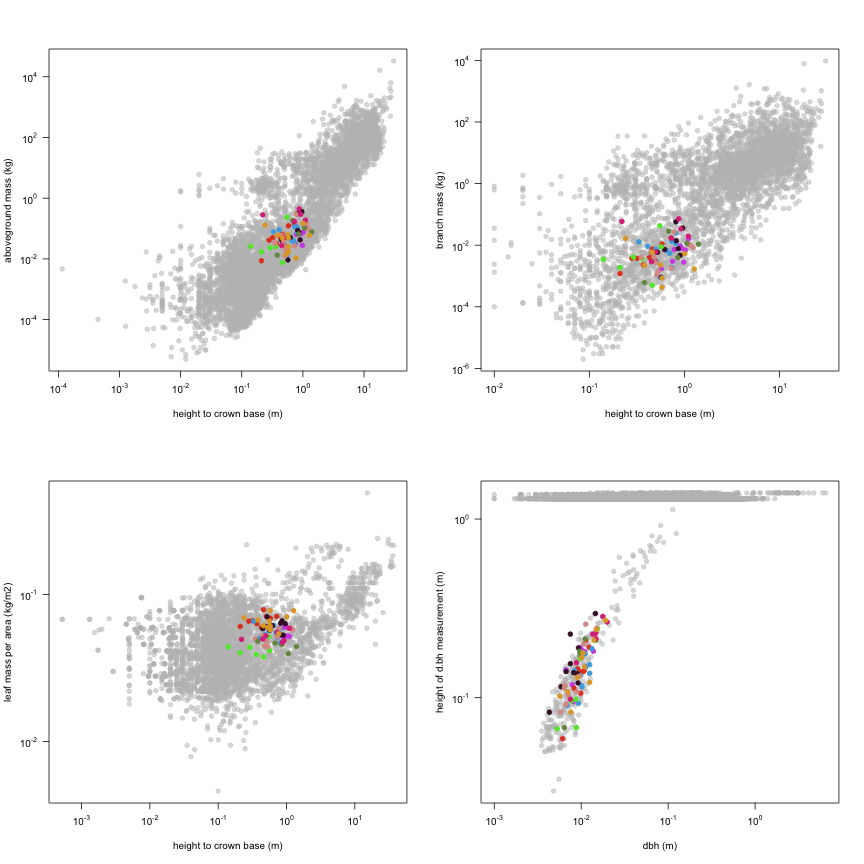
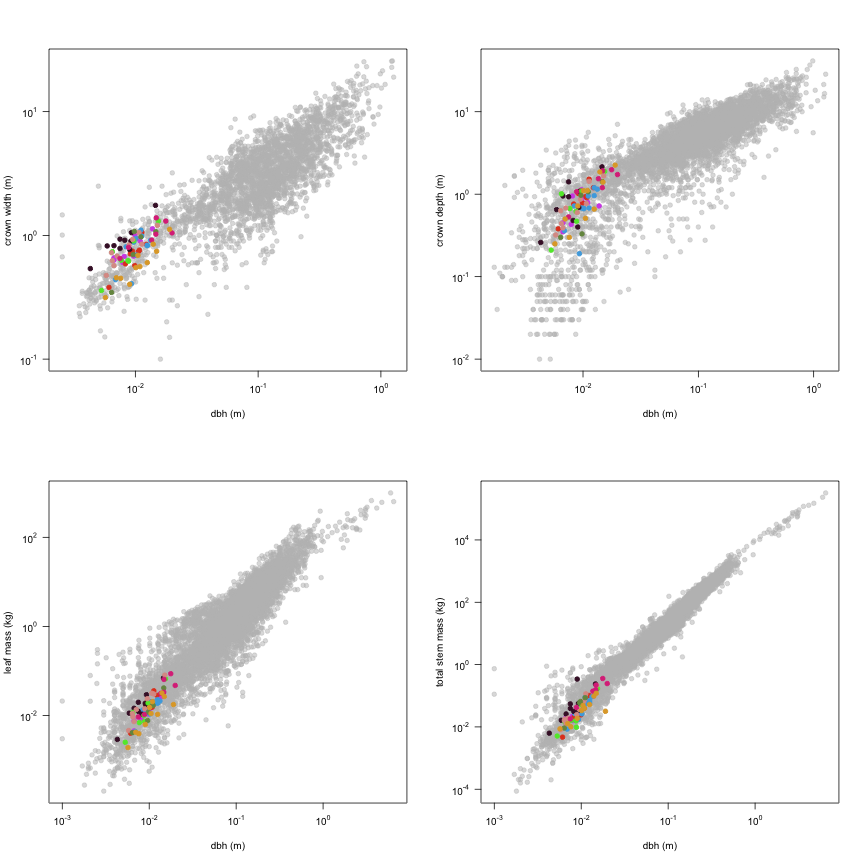
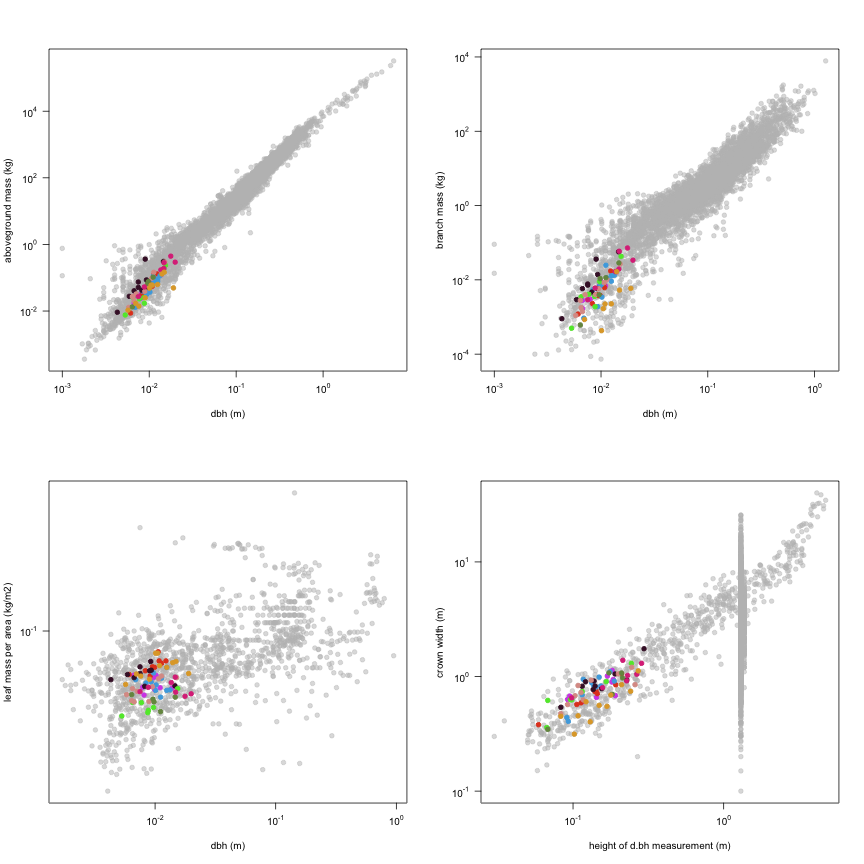
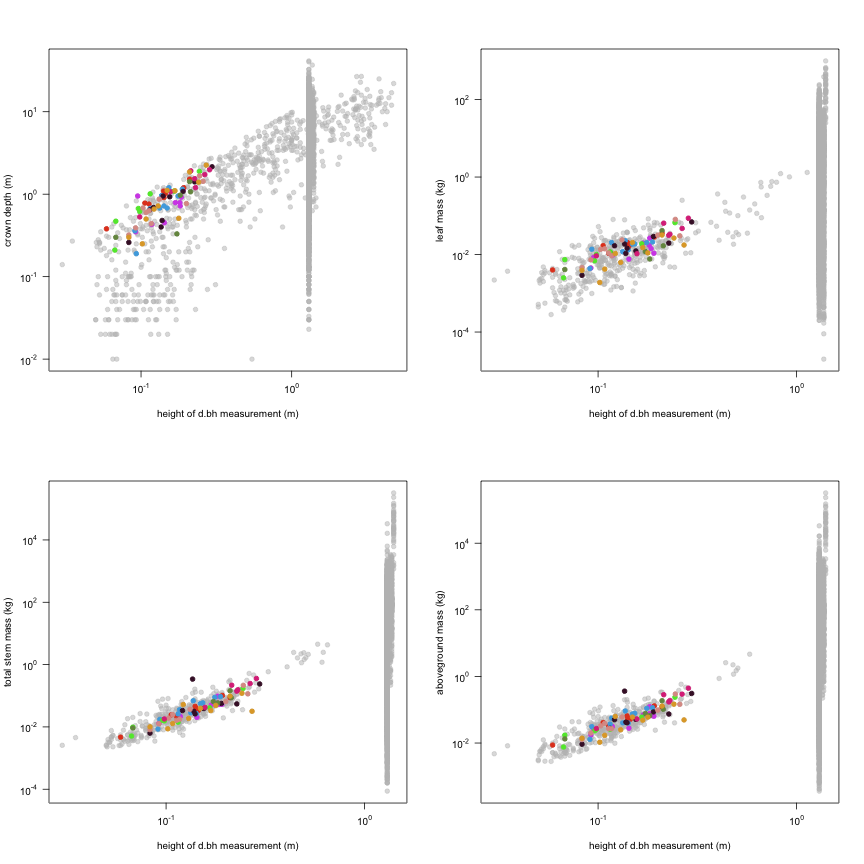
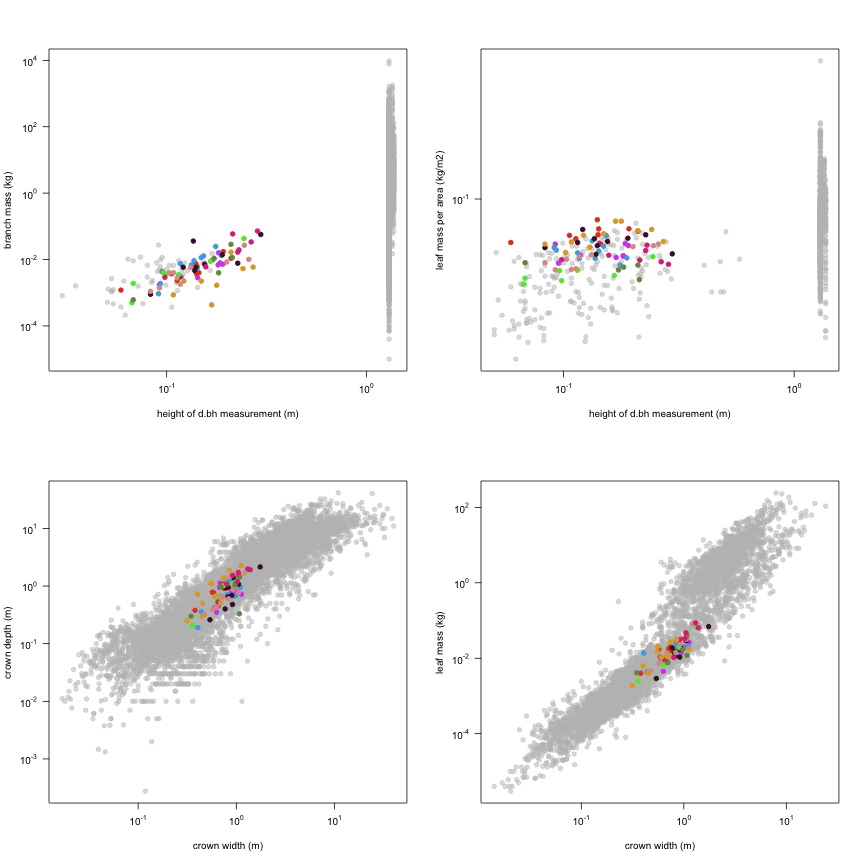
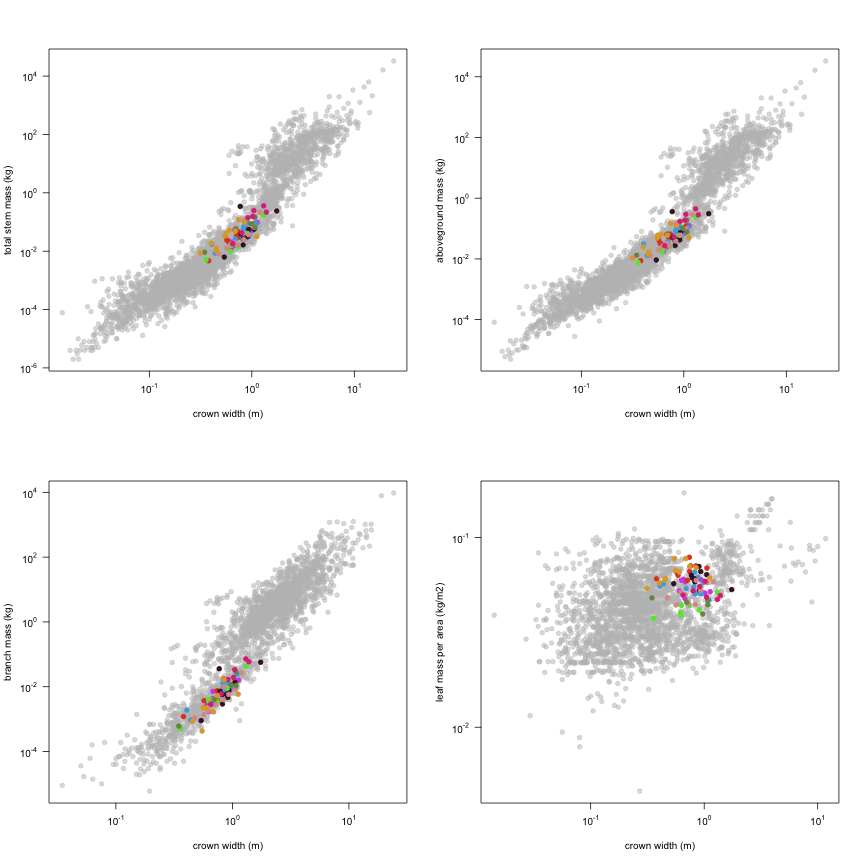
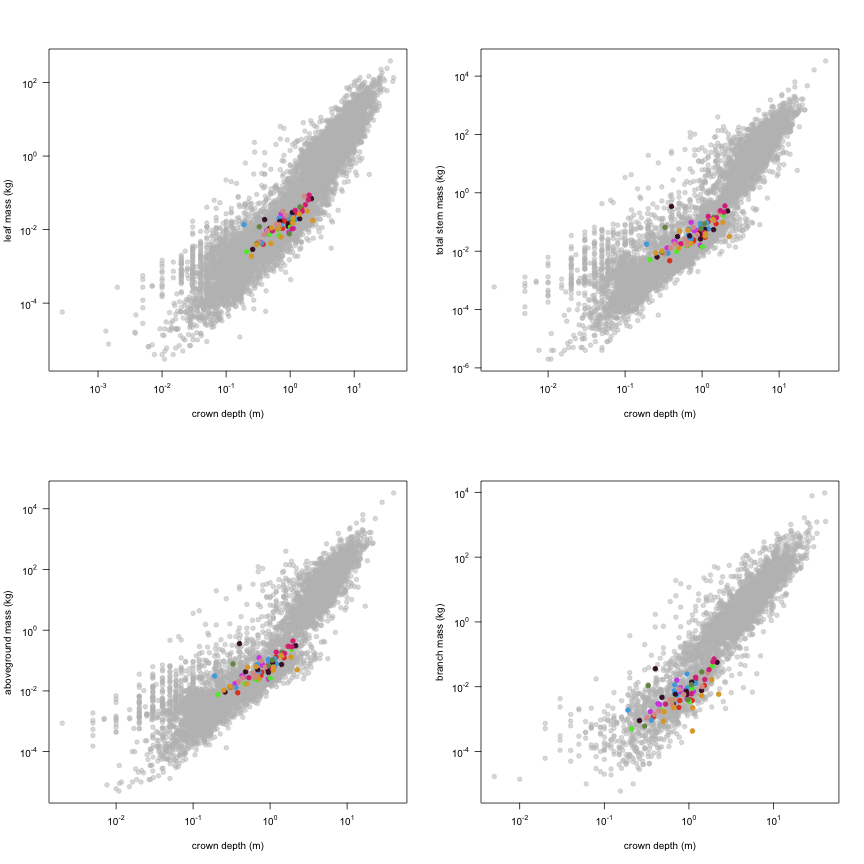
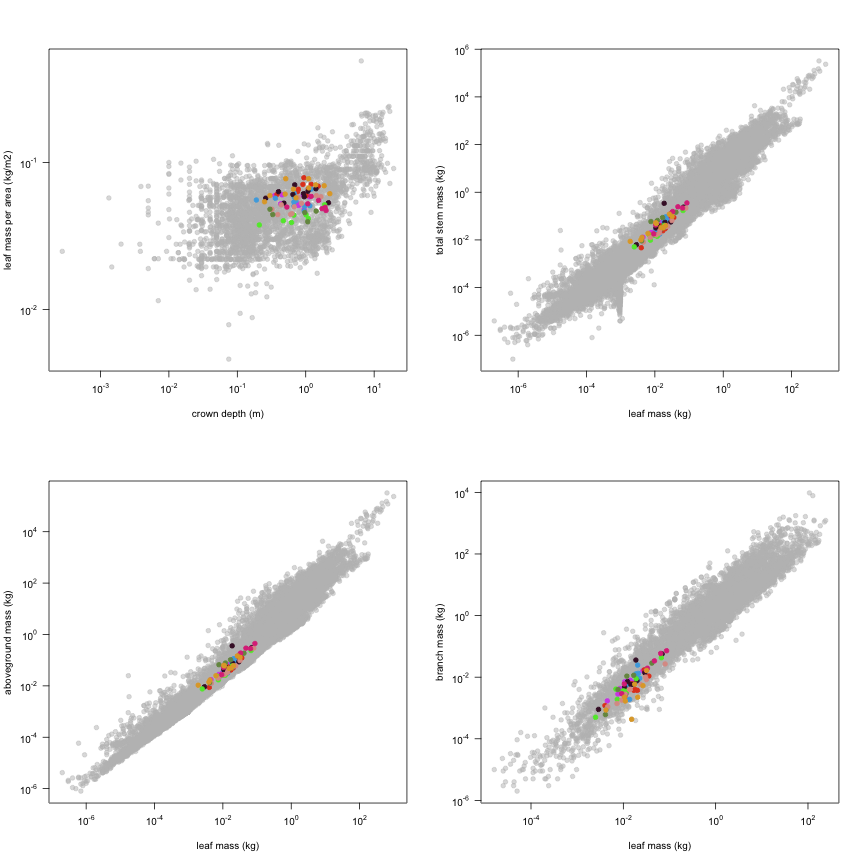
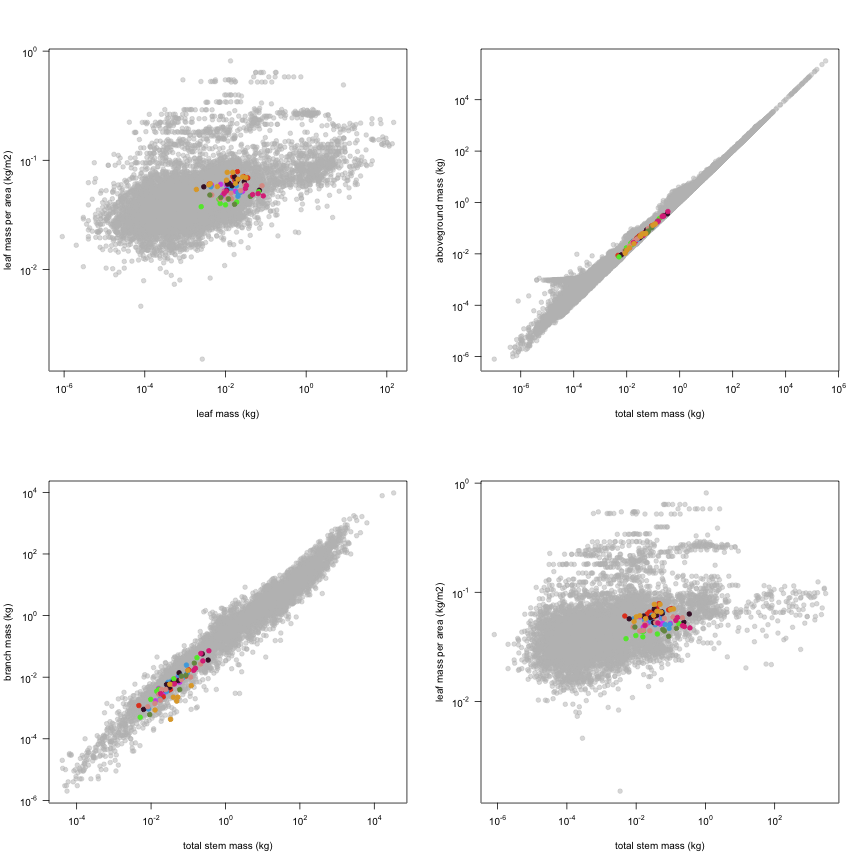
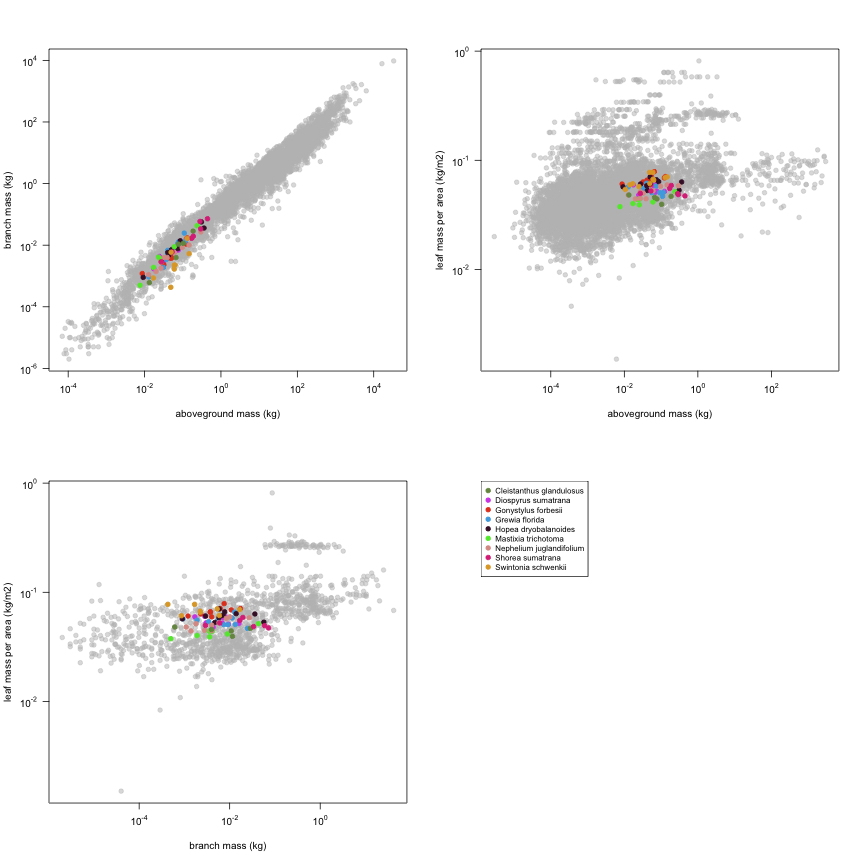
This is how the study Kohyama1990 fits in the entire dataset (grey). each colour represents a species. A legend of species names with colours is included at the end for reports with 1 < n < 20 species.