Hashizume1980
Data contributor: Masae I. Ishihara, Hajime Utsugi, Hiroyuki Tanouchi, Tsutom Hiura
Email: masaish.n@gmail.com
Address:
- Graduate School for International Development and Cooperation, Hiroshima University, 1-5-1 Kagamiyama, Higashi-Hiroshima 739-8529, Japan
- Forestry and Forest Products Research Institute (FFPRI), 1 Matsunosato, Tsukuba, Ibaraki, 305-8687, Japan
- Hokkaido Research Center, Forestry and Forest Products Research Institute (FFPRI), Hitsujigaoka-7, Toyohira, Sapporo, Hokkaido, 062-8516, Japan
- Tomakomai Research Station, Field Science Center for Northern Biosphere, Hokkaido University, Takaoka, Tomakomai 053-0035, Japan
Citation: Hashizume H and Onishi Y (1980). 'On the production structure and productivity of beech forests in the Hiruzen district.' Hardwood research, 1, pp. 73-84.
DOI:
Abstract:
The dataset includes records for 25 individuals from 1 species belonging to 1 family(ies), presenting 1 functional type(s), growing in 1 condition(s) within 1 major type(s) of habitat, with data included for the following variables:
| Variable | Label | Units | N | Min | Median | Max |
|---|---|---|---|---|---|---|
| latitude | Latitude | deg | 25 | 35 | 35 | 35 |
| longitude | Longitude | deg | 25 | 134 | 134 | 134 |
| age | Age | yr | 21 | 20 | 40 | 220 |
| a.stbh | Stem area at breast height | m2 | 25 | 0.000095 | 0.01 | 0.44 |
| h.t | Height | m | 25 | 2.7 | 12 | 28 |
| h.c | Height to crown base | m | 21 | 1.2 | 3.6 | 6 |
| d.bh | Dbh | m | 25 | 0.011 | 0.12 | 0.74 |
| h.bh | Height of d.bh measurement | m | 25 | 1.3 | 1.3 | 1.3 |
| c.d | Crown depth | m | 21 | 1.5 | 5.4 | 23 |
| m.lf | Leaf mass | kg | 24 | 0.02 | 2 | 88 |
| m.st | Total stem mass | kg | 24 | 0.27 | 56 | 4653 |
| m.so | Aboveground mass | kg | 24 | 0.29 | 58 | 4763 |
| m.br | Branch mass | kg | 24 | 0.06 | 13 | 1637 |

And locally within the country:

The sites sampled are:
| Location | Longitude | Latitude | Vegetation |
|---|---|---|---|
| Japan-Hiruzen Forest of Tottori Univeristy- | 133.6 | 35.3 | Temperate forest |
The growing conditions of sampled plants was:
| Location | growingCondition |
|---|---|
| Japan-Hiruzen Forest of Tottori Univeristy- | field wild |
| Species | Family | Pft |
|---|---|---|
| Fagus crenata | Fagaceae | deciduous angiosperm |
Sampling strategy: Survey was conducted in the summer of 1978 (Hashizume and Onishi 1980). Sample trees were selected to represent each diameter class and were felled. Diameter at breast height, tree height, and height of the lowest living branch were measured. Sample trees were treated with the stratified clip technique by cutting them into parts contained in horizontal layers of 0-0.3 m, 0.3-1.3 m, 1.3-2.3 m, and at intervals of 1 m upward.
Height: Measured after sample trees were felled (Hashizume and Onishi 1980).
Biomass: Fresh mass of stem, branches, leaves, and fruits in each layer were measured. Measured fresh mass was converted to dry mass from the ratio of dry to fresh mass (Hashizume and Onishi 1980). The ratio was estimated from subsamples from each layer.
Other variables: M.I. Ishihara, H. Utsugi, H. Tanouchi, and T. Hiura conducted formal search of reference databases and digitized raw data from Hashizume and Onishi (1980). Based on this reference, meta data was also created by M.I. Ishihara. Species name and family names were converted by M.I. Ishihara according to the following references: Satake Y, Hara H (1989a) Wild flower of Japan Woody plants I (in Japanese). Heibonsha, Tokyo; Satake Y, Hara H (1989b) Wild flower of Japan Woody plants II (in Japanese). Heibonsha, Tokyo.
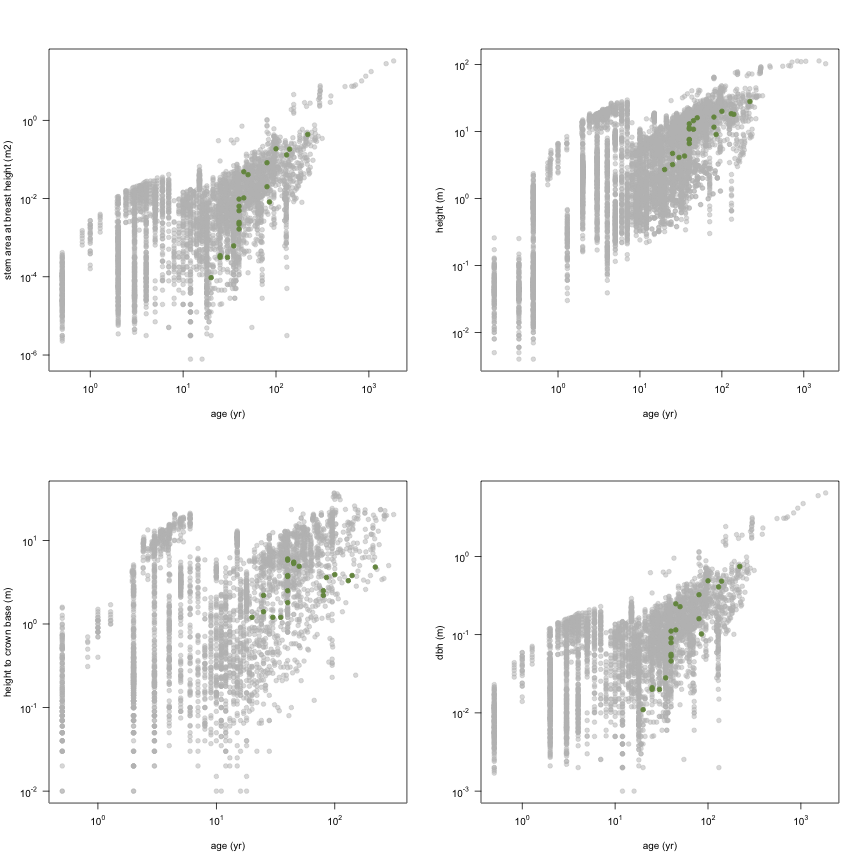
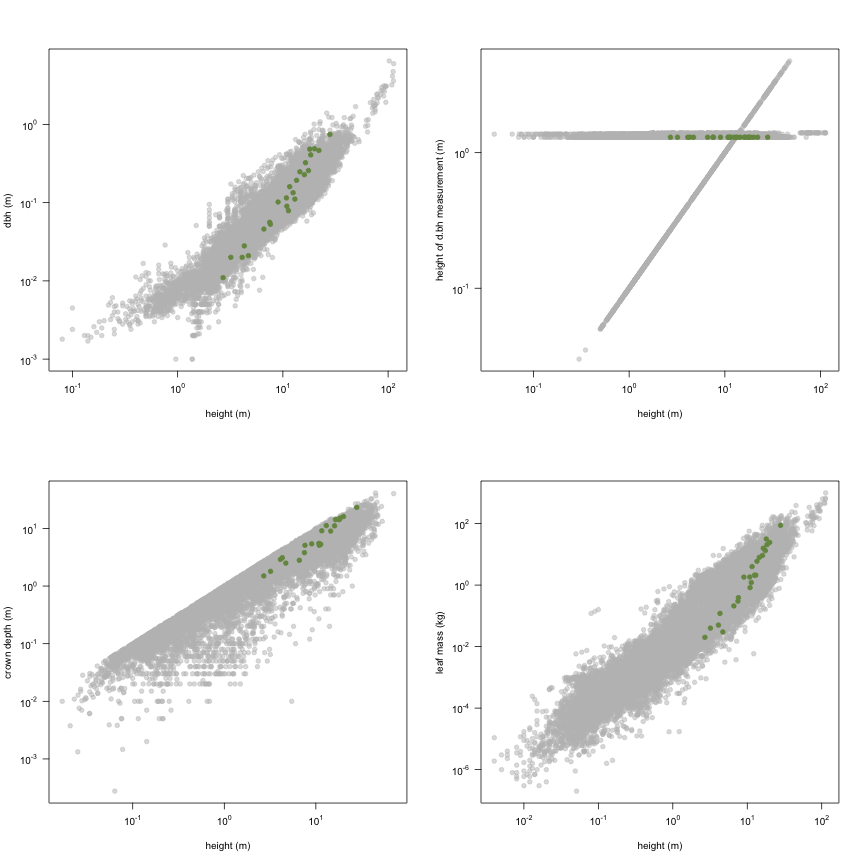
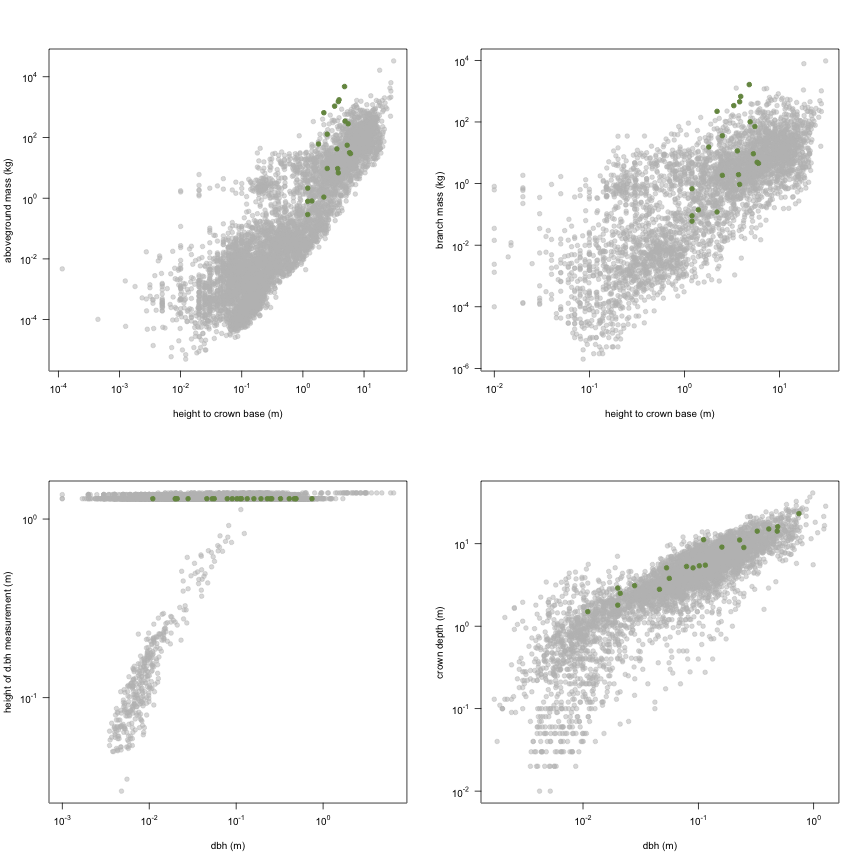
This is how the study Hashizume1980 fits in the entire dataset (grey). each colour represents a species. A legend of species names with colours is included at the end for reports with 1 < n < 20 species.