Parviainen1999
Data contributor: Annikki Mäkelä
Email: annikki.makela@helsinki.fi
Address:
- Department of Forest Sciences, P.O.Box 27 (Latokartanonkaari 7), 00014 University of Helsinki, Finland
Citation: Parviainen T (1999). 'MSc thesis: Investigating the biomass and crown structure of mixed stand birch trees for process-based models. [In Finnish.].' University of Helsinki.
DOI:
Abstract: The objective of this study was to analyse the above-ground structure of birch (Betula pendula) for testing structural hypotheses used in process-based growth models. 12 dominant trees from stands of different height were measured for foliage, branch and stem biomass and crown structure. Allometric functions were derived to predict leaf mass, lear area and branch mass from cross-sectional area at breast height and crown base as well as from crown length and crown surface area.
The dataset includes records for 12 individuals from 1 species belonging to 1 family(ies), presenting 1 functional type(s), growing in 1 condition(s) within 1 major type(s) of habitat, with data included for the following variables:
| Variable | Label | Units | N | Min | Median | Max |
|---|---|---|---|---|---|---|
| latitude | Latitude | deg | 12 | 62 | 62 | 62 |
| longitude | Longitude | deg | 12 | 24 | 24 | 24 |
| age | Age | yr | 12 | 3 | 12 | 74 |
| a.stbh | Stem area at breast height | m2 | 12 | 0.00002 | 0.0042 | 0.11 |
| a.cp | Crown area | m2 | 12 | 0.54 | 6.1 | 23 |
| h.t | Height | m | 12 | 1.8 | 8 | 28 |
| h.c | Height to crown base | m | 12 | 0.4 | 1.6 | 9.7 |
| d.bh | Dbh | m | 12 | 0.005 | 0.074 | 0.37 |
| h.bh | Height of d.bh measurement | m | 12 | 1.3 | 1.3 | 1.3 |
| d.cr | Crown width | m | 12 | 0.83 | 2.8 | 5.5 |
| c.d | Crown depth | m | 12 | 1.4 | 6.4 | 18 |
| m.lf | Leaf mass | kg | 12 | 0.04 | 1.2 | 15 |
| m.st | Total stem mass | kg | 12 | 0.06 | 7.8 | 652 |
| m.so | Aboveground mass | kg | 12 | 0.1 | 9 | 666 |
| m.br | Branch mass | kg | 12 | 0.019 | 2.1 | 101 |
And locally within the country:

The sites sampled are:
| Location | Longitude | Latitude | Vegetation |
|---|---|---|---|
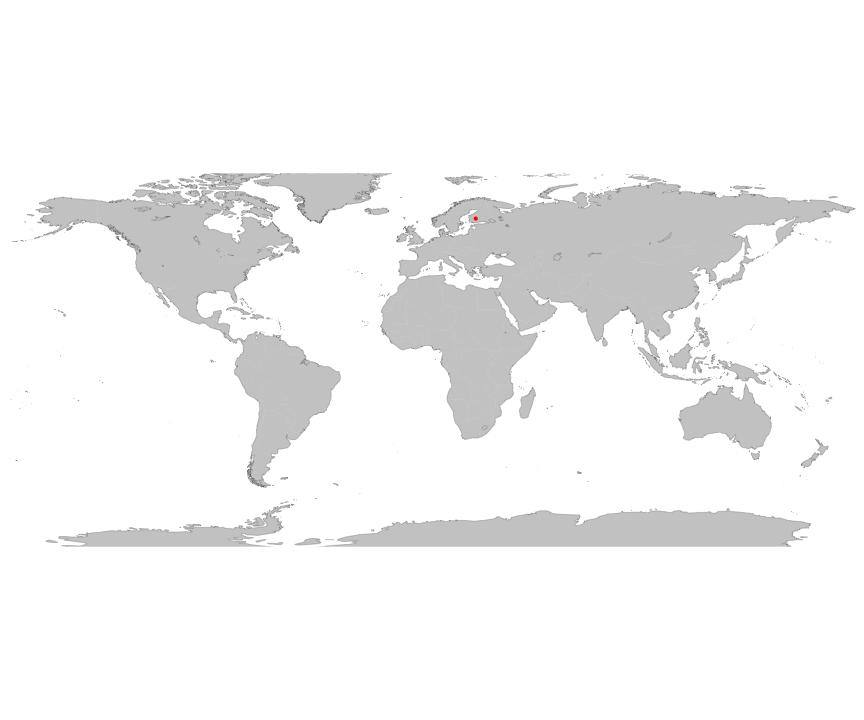
| Juupajoki, Finland | 24.283 | 61.85 | Boreal forest |
The growing conditions of sampled plants was:
| Location | growingCondition |
|---|---|
| Juupajoki, Finland | field wild |
| Species | Family | Pft |
|---|---|---|
| Betula pendula | Betulaceae | deciduous angiosperm |
Sampling strategy: 12 dominant Silver birch trees were sampled from 7 mixed stands with minimum 10% birch mixture. The trees were chosen to represent a continuum of tree height. The measurements were done in August 1996.
Leaf area: Leaf area estimate was based on leaf biomass (see below) and specific leaf area. SLA (projected) was measured on sample leaves (12.65 m2/kg).
Stem cross sectional area: Stem cross sectional area was determined from sample disks taken at breast height (1.3 m) and at crown base. The cross section was calculated as a circle with radius equalling the average of the largest diameter and that perpendicular to it.
Height: Height was measured using a tape measure on the felled trees that had been felled with minimum possible stump.
Crown area: Before felling, the width of the crown was measured at the widest diameter and the one perpendicular to that. Crown area was calculated as an ellipsoid from mean crown width and crown length.
Biomass: Branches were sampled systematically, taking each nth branch from the top to the bottom of the crown such that the total nr of sample branches was 10. Discs were taken from the stem at a number of heights, all including breast height and crown base. Tree-wise regression models were developed for the sample branches to estimate leaf and branch dry mass from branch diameter and distance from the tree top, which were measured from all live branches in the crown. Stem volume was calculated from the logs between the disc measurement heights by assuming the logs as cut cones. The volume was converted to stem biomass using wood density of the lower disc of each log, obtained by weighing and immersion of the disc.
Traits: SLA = 12.6
Year collected: 1996
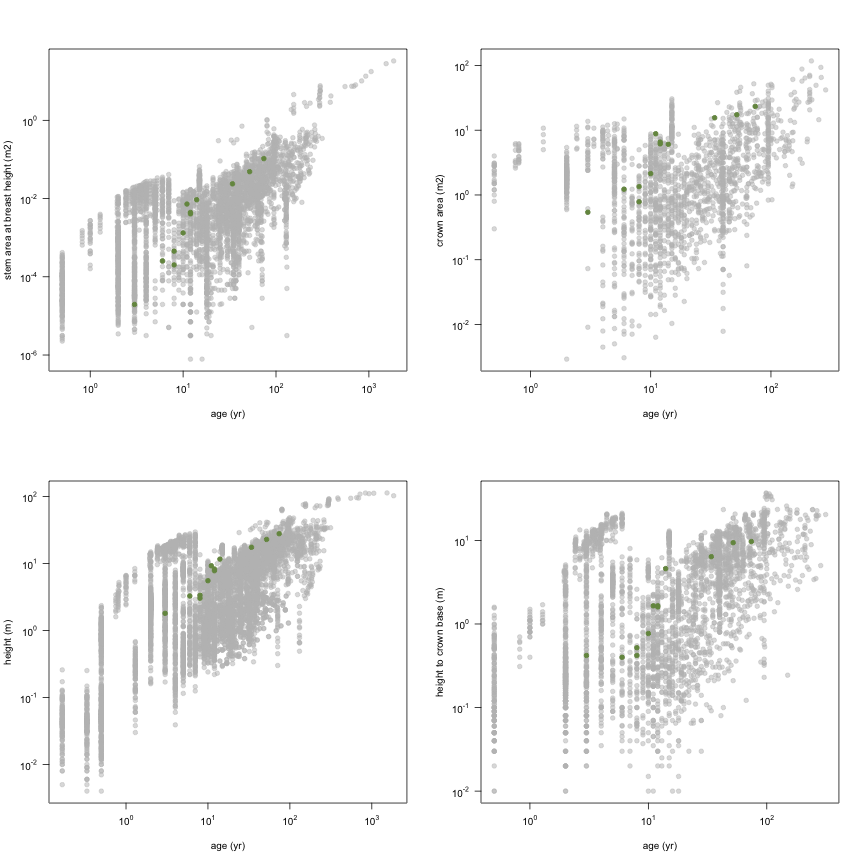
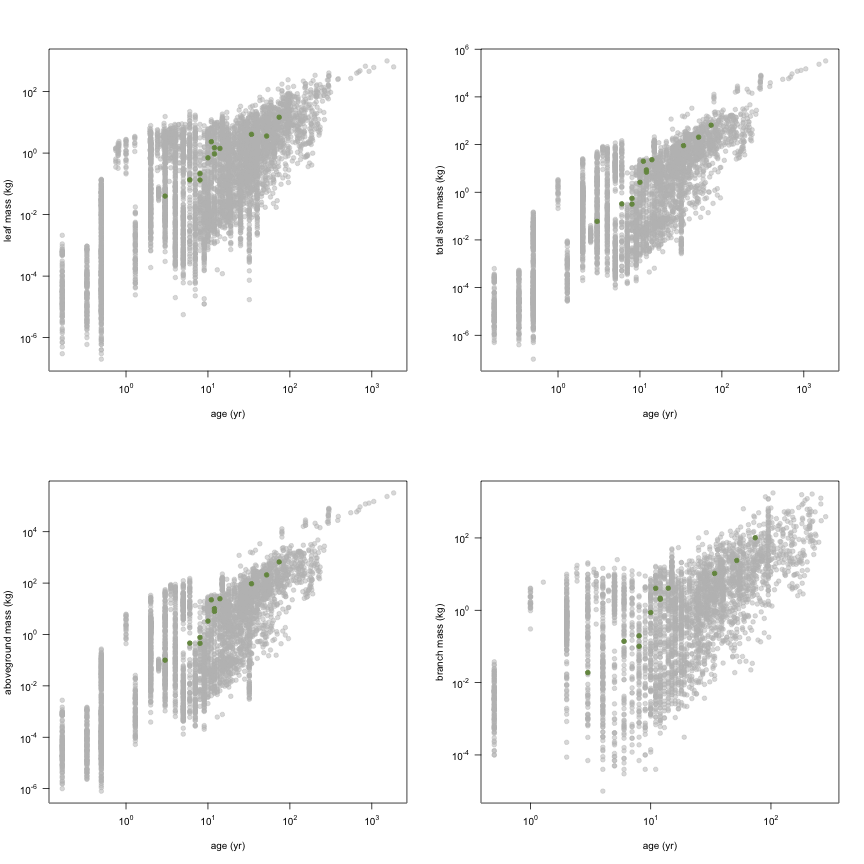
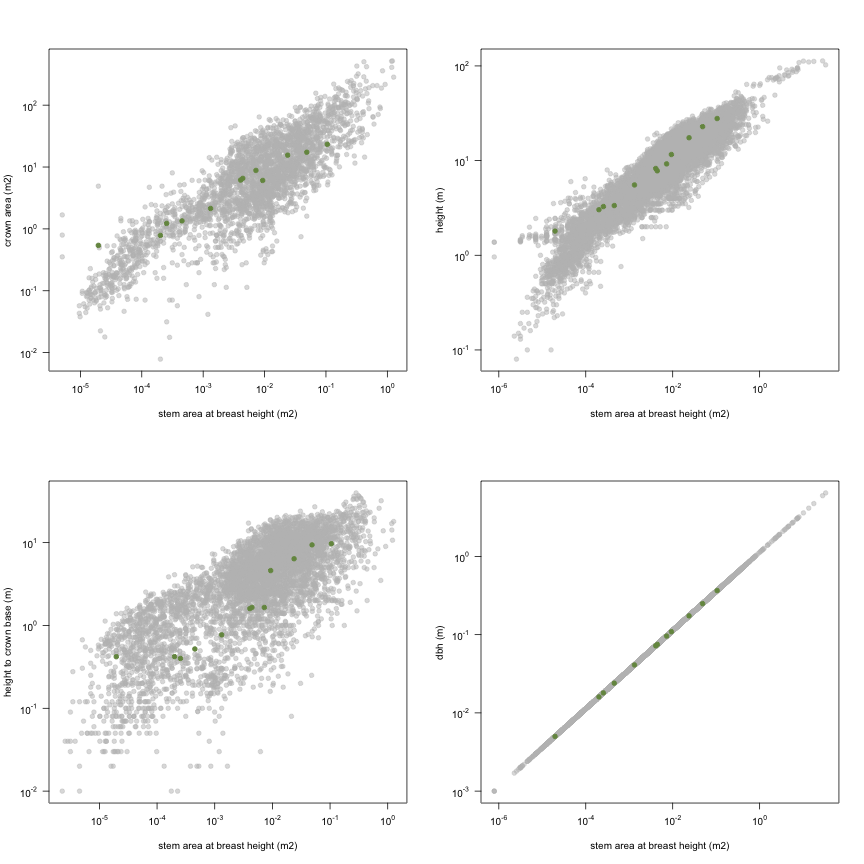
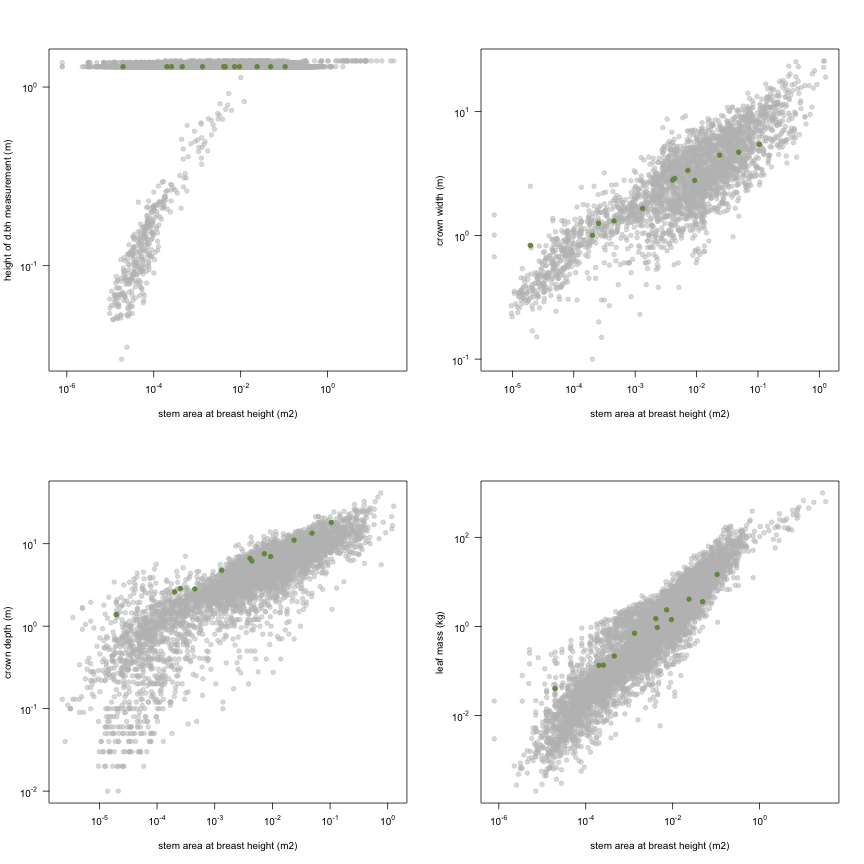
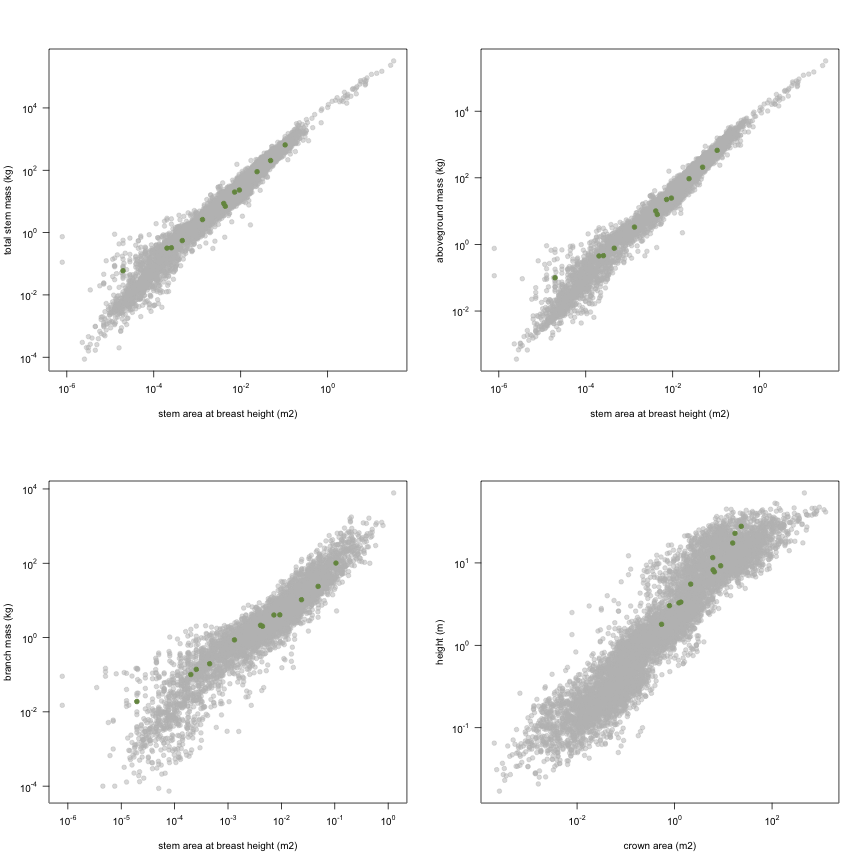
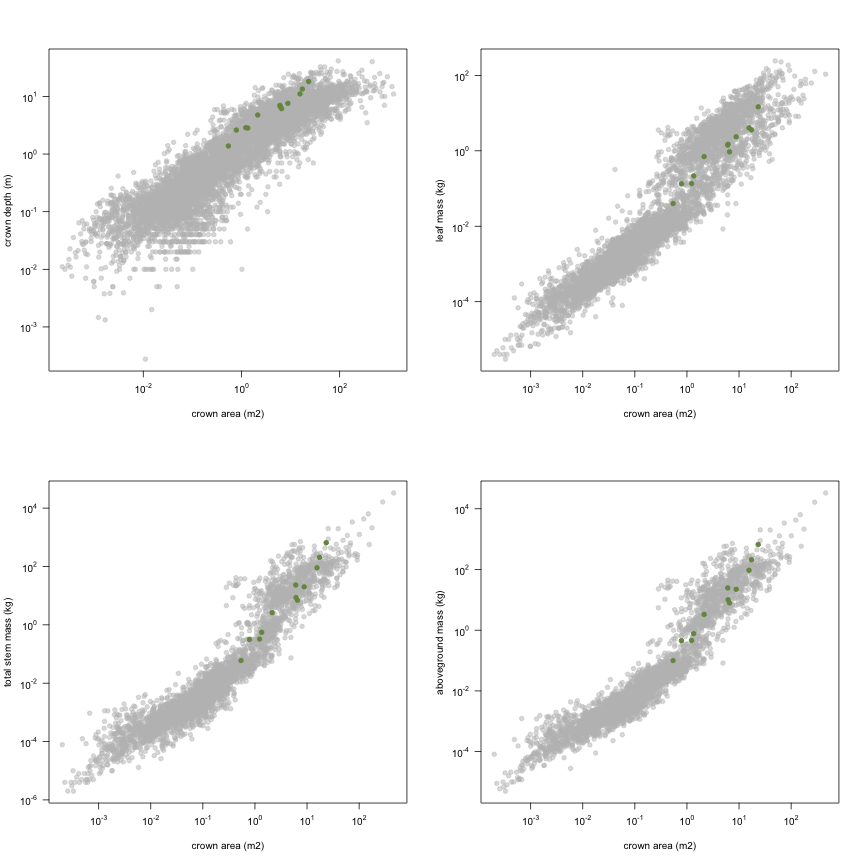
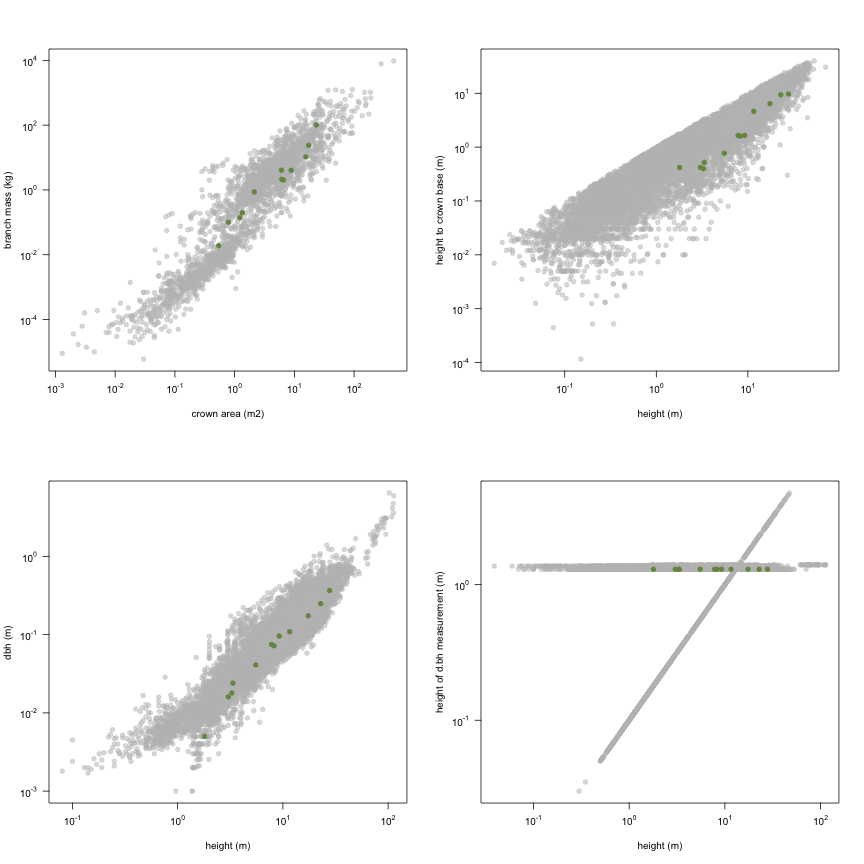
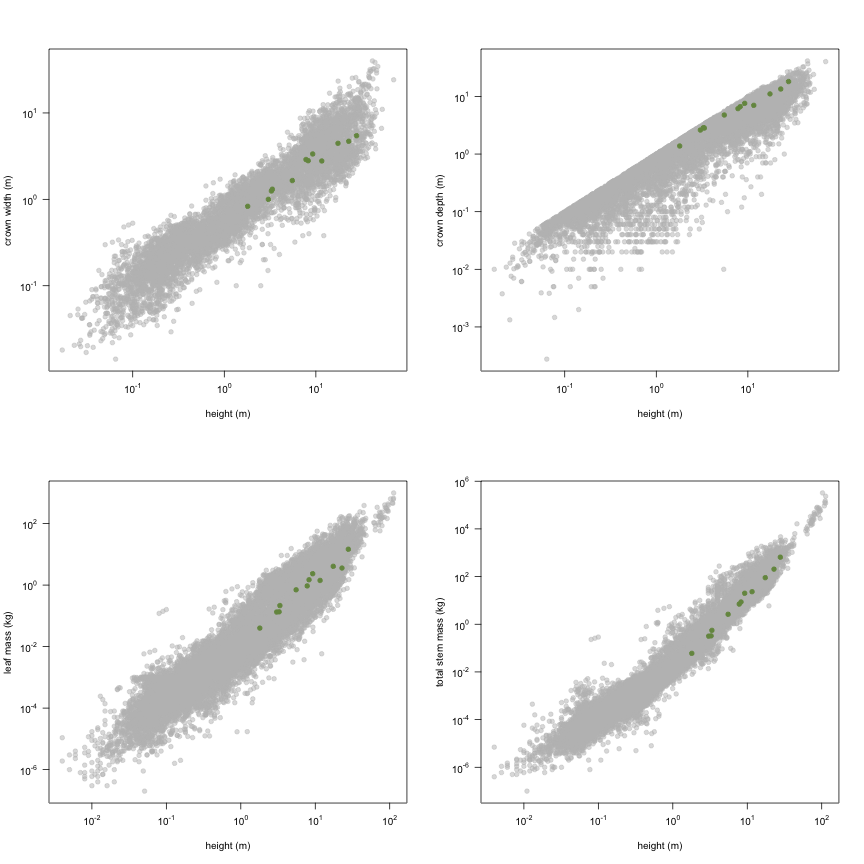
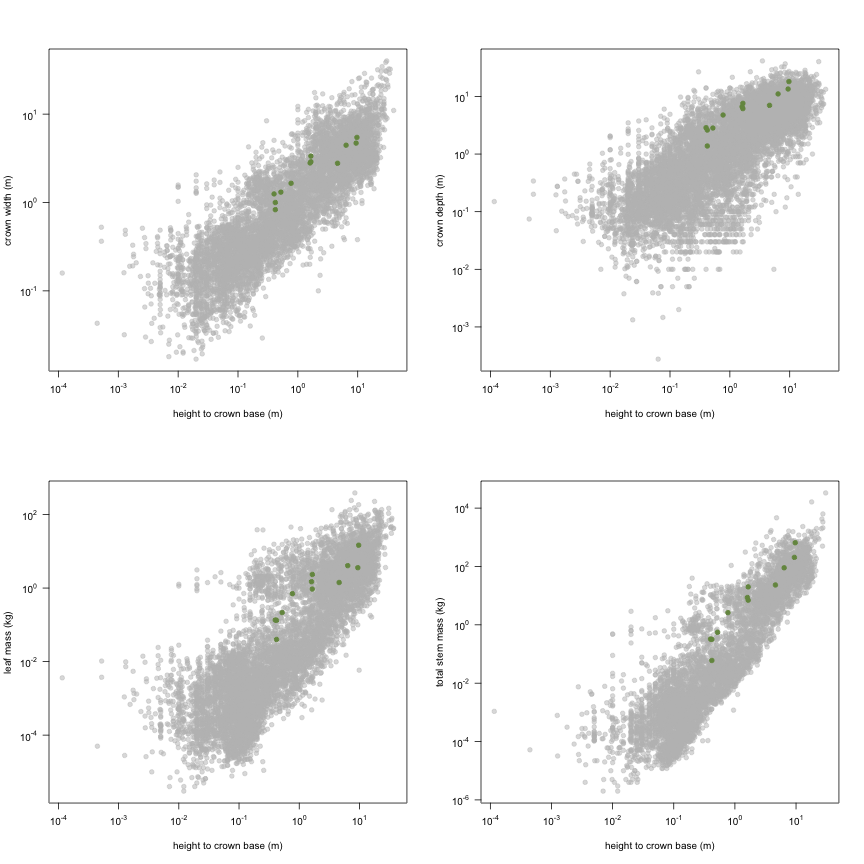
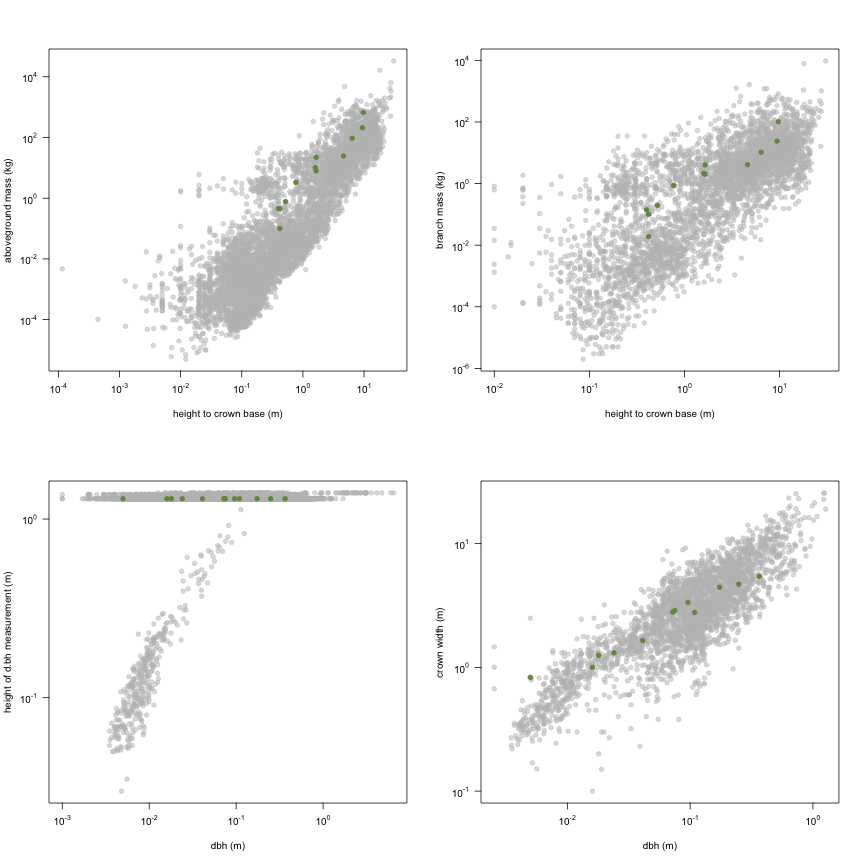
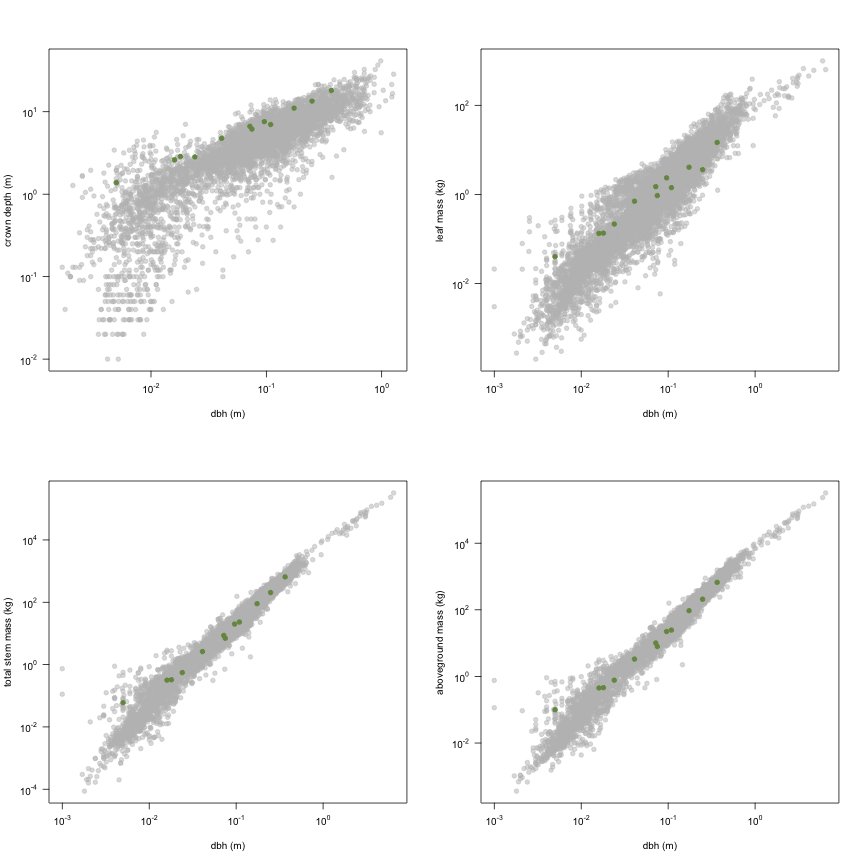
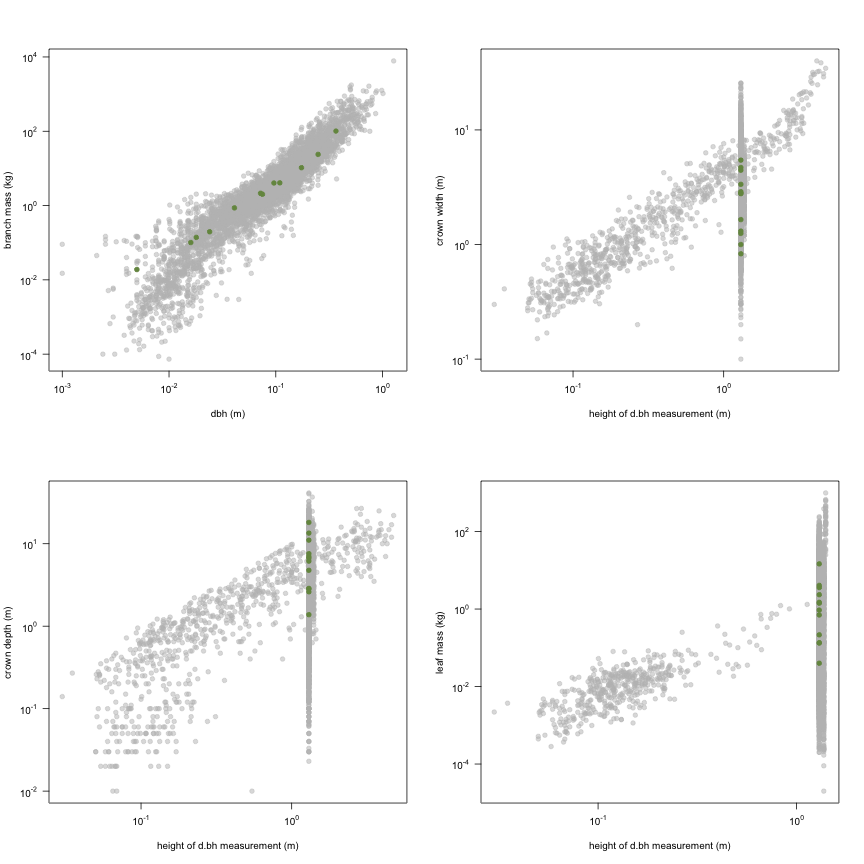
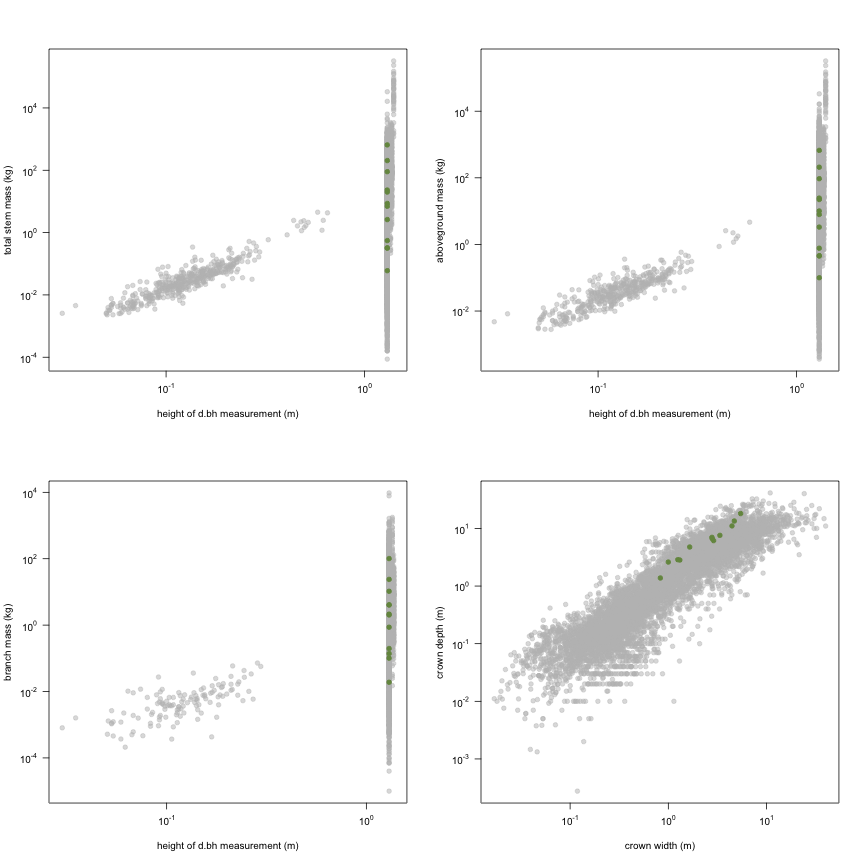
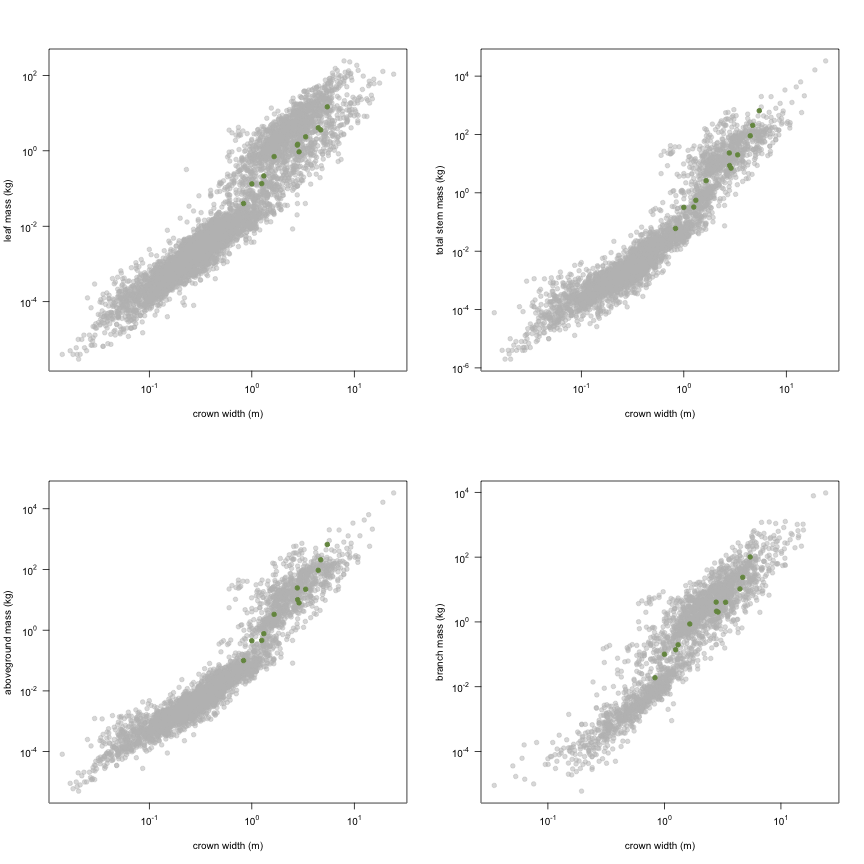
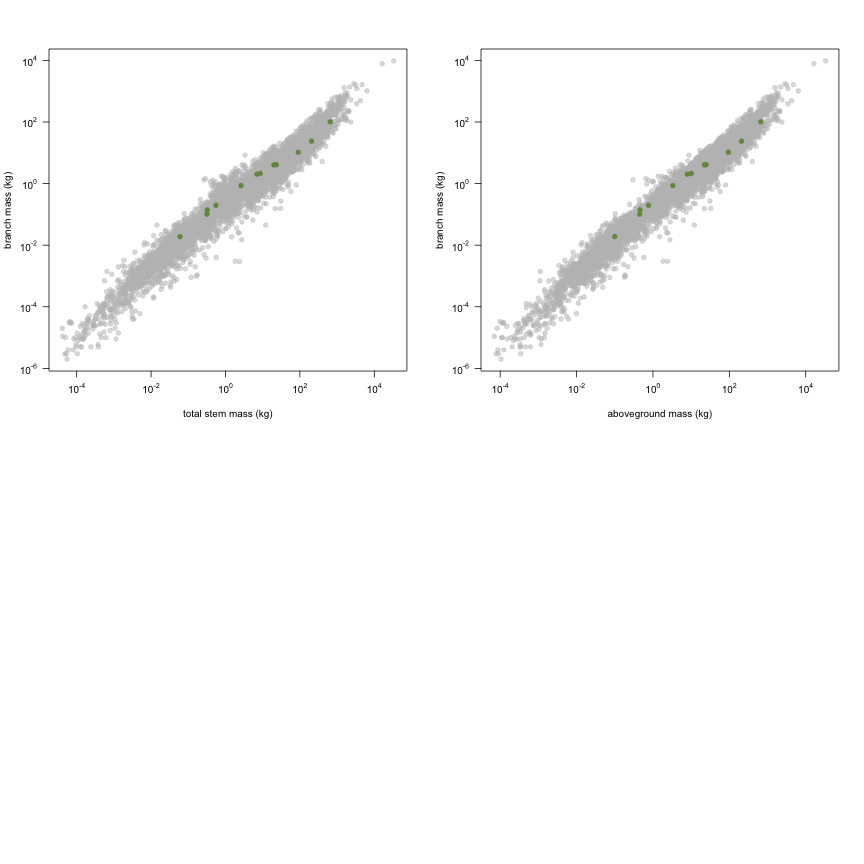
This is how the study Parviainen1999 fits in the entire dataset (grey). each colour represents a species. A legend of species names with colours is included at the end for reports with 1 < n < 20 species.