OGrady2006
Data contributor: Anthony P. O'Grady
Email: anthony.ogrady@csiro.au
Address:
- CSIRO Land and Water Flagship, Private Bag 12, Hobart Tasmania 7009, Australia
Citation: O'Grady A, Worledge D and Battaglia M (2006). 'Above- and below-ground relationships, with particular reference to fine roots, in a young Eucalyptus globulus (Labill.) stand in southern Tasmania.' Trees, 20(5), pp. 531-538.
DOI: 10.1007/s00468-006-0055-5
Abstract: Allometric relationships are important descriptors of tree form and are often used to scale physiological process measured at the individual tree scale to the stand scale. Despite their importance, there is little information relating above-ground form and function to below-ground form and function. In this paper, we present allometric relationships between above- and below-ground components for young (2 years old) Eucalyptus globulus, a globally important plantation tree species, in southern Tasmania, Australia. In particular, we examined relationships that exist between leaf area, above-ground biomass, fine root surface area and fine root biomass using destructive harvesting techniques. Fine roots (5 mm) were sampled spatially and temporally using sequential coring and scaled to estimate total fine root biomass and total fine root surface area using a weighting technique. There were strong relationships between leaf area and above-ground biomass with below-ground fine root surface area and biomass. These results are discussed in relation to the functional balance hypothesis for water transport in plants.
The dataset includes records for 68 individuals from 1 species belonging to 1 family(ies), presenting 1 functional type(s), growing in 1 condition(s) within 1 major type(s) of habitat, with data included for the following variables:
| Variable | Label | Units | N | Min | Median | Max |
|---|---|---|---|---|---|---|
| latitude | Latitude | deg | 68 | -43 | -43 | -43 |
| longitude | Longitude | deg | 68 | 148 | 148 | 148 |
| a.lf | Leaf area | m2 | 68 | 0.019 | 1.2 | 106 |
| a.ssba | Sapwood area at base | m2 | 26 | 0.00053 | 0.0011 | 0.034 |
| a.ssbh | Sapwood area at breast height | m2 | 6 | 0.0031 | 0.011 | 0.019 |
| a.stba | Stem area at base | m2 | 65 | 0.0000074 | 0.0003 | 0.059 |
| a.stbh | Stem area at breast height | m2 | 9 | 0.0061 | 0.023 | 0.042 |
| h.t | Height | m | 17 | 0.26 | 0.35 | 0.46 |
| d.ba | Basal diameter | m | 65 | 0.0031 | 0.02 | 0.27 |
| d.bh | Dbh | m | 9 | 0.088 | 0.17 | 0.23 |
| h.bh | Height of d.bh measurement | m | 68 | 1.3 | 1.3 | 1.3 |
| m.lf | Leaf mass | kg | 65 | 0.0014 | 0.16 | 25 |
| m.st | Total stem mass | kg | 44 | 0.0031 | 0.26 | 60 |
| m.so | Aboveground mass | kg | 44 | 0.011 | 0.5 | 68 |
| m.br | Branch mass | kg | 50 | 0.00078 | 0.16 | 44 |
| m.rf | Fine root mass | kg | 15 | 0.022 | 0.69 | 3.9 |
| m.rc | Coarse root mass | kg | 15 | 0.028 | 6 | 30 |
| m.rt | Total root mass | kg | 15 | 0.049 | 7 | 34 |
| m.to | Total mass | kg | 6 | 0.52 | 21 | 80 |
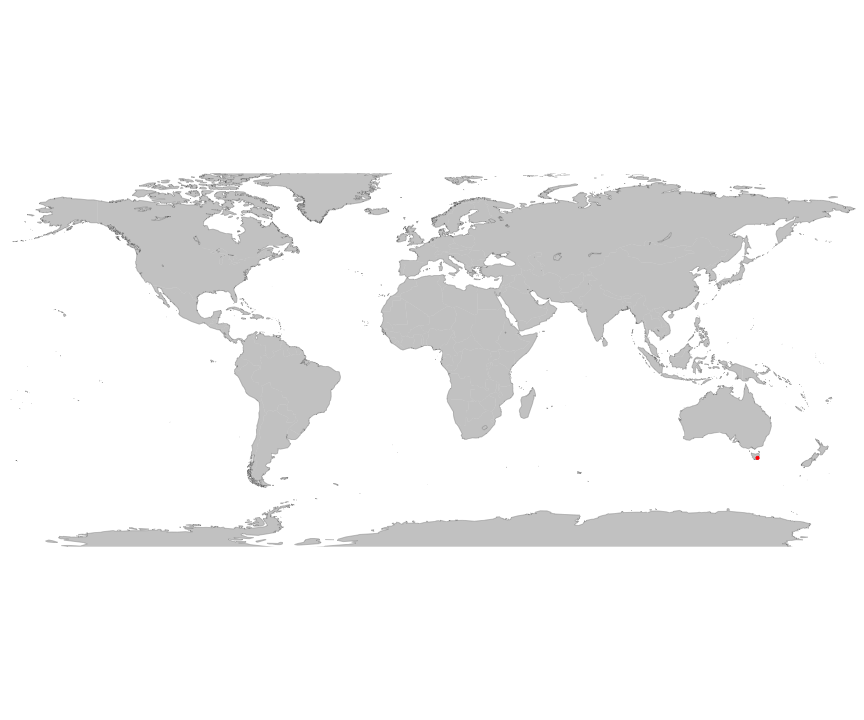
And locally within the country:

The sites sampled are:
| Location | Longitude | Latitude | Vegetation |
|---|---|---|---|
| Pittwater plantation, TAS, Australia | 147.51 | -42.82 | Temperate forest |
The growing conditions of sampled plants was:
| Location | Grouping | growingCondition |
|---|---|---|
| Pittwater plantation, TAS, Australia | Harvested = Dec_02; plot = 1 | plantation managed |
| Pittwater plantation, TAS, Australia | Harvested = Dec_02; plot = 2 | plantation managed |
| Pittwater plantation, TAS, Australia | Harvested = Dec_02; plot = 3 | plantation managed |
| Pittwater plantation, TAS, Australia | Harvested = Dec_02; plot = 4 | plantation managed |
| Pittwater plantation, TAS, Australia | Harvested = Dec_02; plot = 5 | plantation managed |
| Pittwater plantation, TAS, Australia | Harvested = Dec_02; plot = 6 | plantation managed |
| Pittwater plantation, TAS, Australia | Harvested = Dec_02; plot = 7 | plantation managed |
| Pittwater plantation, TAS, Australia | Harvested = Dec_02; plot = 8 | plantation managed |
| Pittwater plantation, TAS, Australia | Harvested = Dec_02; plot = 9 | plantation managed |
| Pittwater plantation, TAS, Australia | Harvested = Mar_03; plot = 1 | plantation managed |
| Pittwater plantation, TAS, Australia | Harvested = Mar_03; plot = 2 | plantation managed |
| Pittwater plantation, TAS, Australia | Harvested = Mar_03; plot = 3 | plantation managed |
| Pittwater plantation, TAS, Australia | Harvested = Mar_03; plot = 4 | plantation managed |
| Pittwater plantation, TAS, Australia | Harvested = Mar_03; plot = 5 | plantation managed |
| Pittwater plantation, TAS, Australia | Harvested = Mar_03; plot = 6 | plantation managed |
| Pittwater plantation, TAS, Australia | Harvested = Mar_03; plot = 7 | plantation managed |
| Pittwater plantation, TAS, Australia | Harvested = Mar_03; plot = 8 | plantation managed |
| Pittwater plantation, TAS, Australia | Harvested = Mar_03; plot = 9 | plantation managed |
| Pittwater plantation, TAS, Australia | Harvested = Jun_03; plot = 1 | plantation managed |
| Pittwater plantation, TAS, Australia | Harvested = Jun_03; plot = 2 | plantation managed |
| Pittwater plantation, TAS, Australia | Harvested = Jun_03; plot = 3 | plantation managed |
| Pittwater plantation, TAS, Australia | Harvested = Jun_03; plot = 4 | plantation managed |
| Pittwater plantation, TAS, Australia | Harvested = Jun_03; plot = 5 | plantation managed |
| Pittwater plantation, TAS, Australia | Harvested = Jun_03; plot = 6 | plantation managed |
| Pittwater plantation, TAS, Australia | Harvested = Jun_03; plot = 7 | plantation managed |
| Pittwater plantation, TAS, Australia | Harvested = Jun_03; plot = 8 | plantation managed |
| Pittwater plantation, TAS, Australia | Harvested = Jun_03; plot = 9 | plantation managed |
| Pittwater plantation, TAS, Australia | Harvested = Oct_03; plot = 1 | plantation managed |
| Pittwater plantation, TAS, Australia | Harvested = Oct_03; plot = 5 | plantation managed |
| Pittwater plantation, TAS, Australia | Harvested = Oct_03; plot = 9 | plantation managed |
| Pittwater plantation, TAS, Australia | Harvested = Jan_04; plot = | plantation managed |
| Pittwater plantation, TAS, Australia | Harvested = Aug_07; plot = 2 | plantation managed |
| Pittwater plantation, TAS, Australia | Harvested = Jul_08; plot = 3 | plantation managed |
| Pittwater plantation, TAS, Australia | Harvested = Jul_08; plot = 4 | plantation managed |
| Pittwater plantation, TAS, Australia | Harvested = Jul_08; plot = 8 | plantation managed |
| Species | Family | Pft |
|---|---|---|
| Eucalyptus globulus | Myrtaceae | evergreen angiosperm |
Sampling strategy: Data are for rainfed and irrigated trees. Trees were a monospecific stand of Eucalyptus globulus grown at a spacing of 3X3 meters. All allometric relationships were developed from above and below ground harvests.
Leaf area: Leaf area samples were taken from each of three zones within the canopy, upper, mid and lower. A subsample of leaves from each zone was used to determine specific leaf area. Leaf area of the zone was calculated as the product of specific leaf area and leaf dry weight for each zone.
Height: Heights were measured monthly using height poles. At the time of harvets height to the growing tip was checked using a tape measure
Biomass: Each tree was subdivided into it components, of stem, branches, leaf area, fine roots and coarse roots. All material was dried to constant weight in a drying room at 30 deg C. Subsamples of each sample were dried at 65 deg C to constant weight, and a dry weight conversion factor was used to estimate the total dry weight.
Year collected: 2000-2005
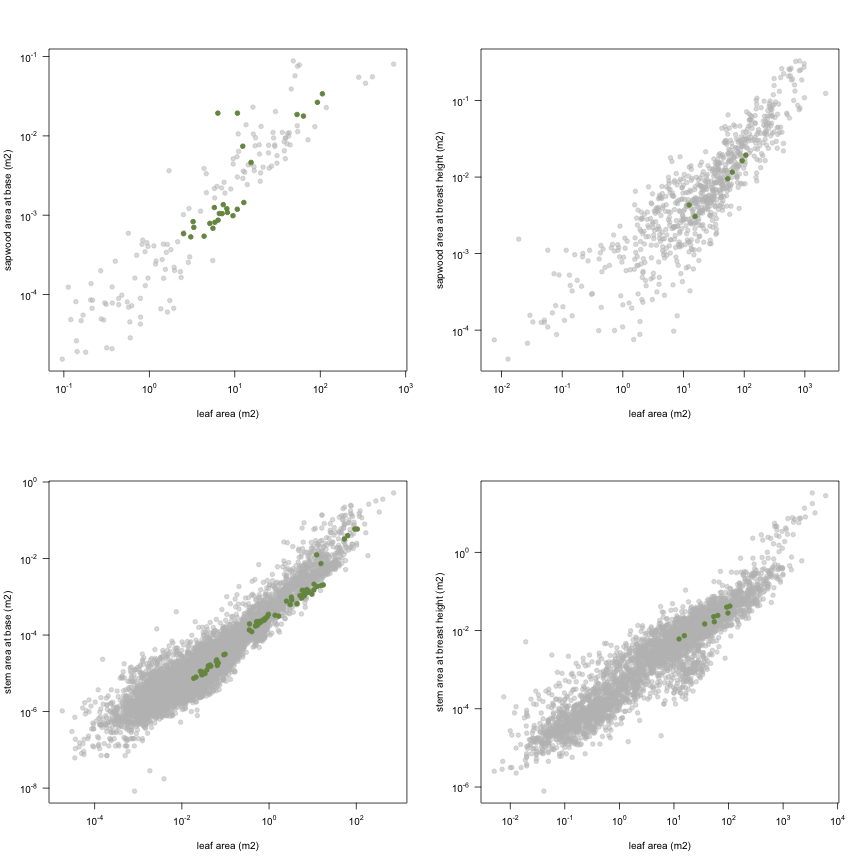
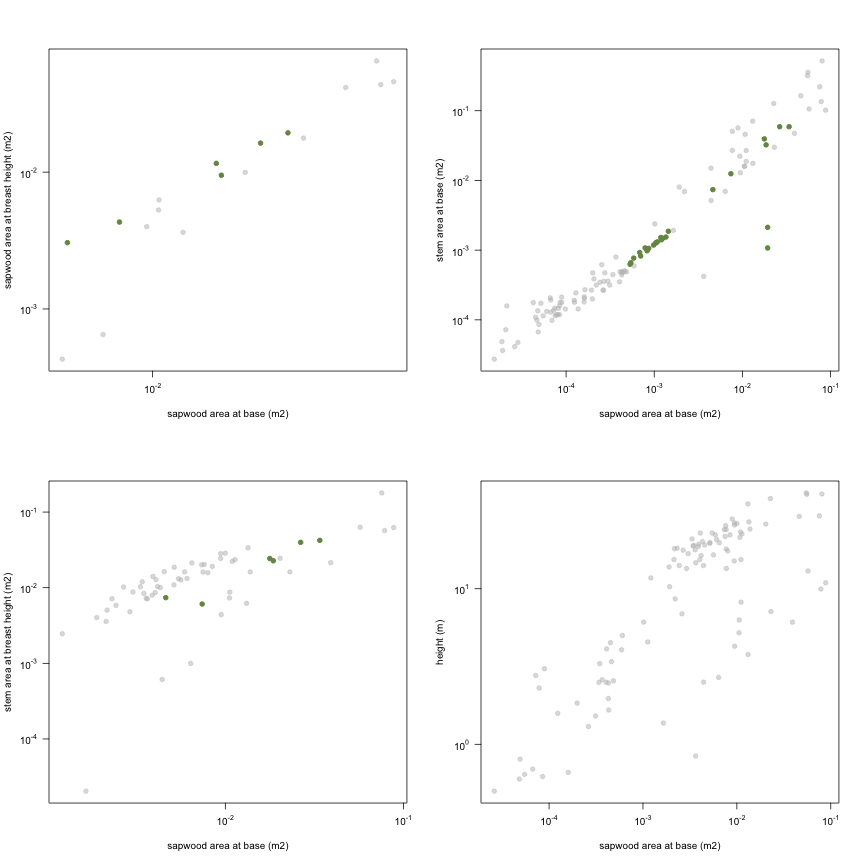
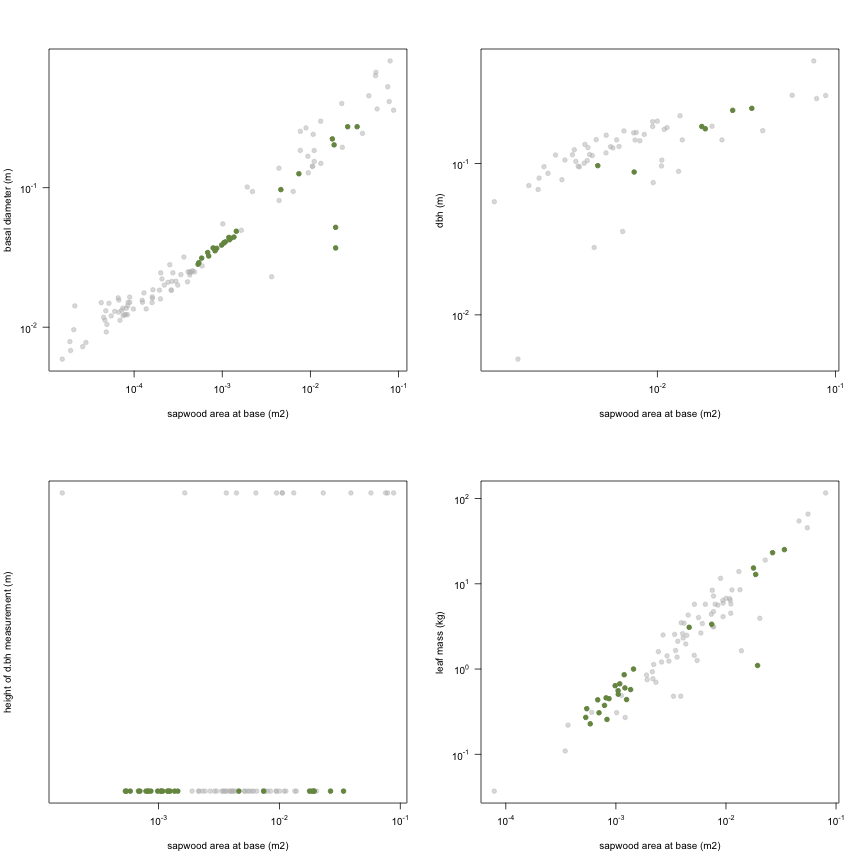
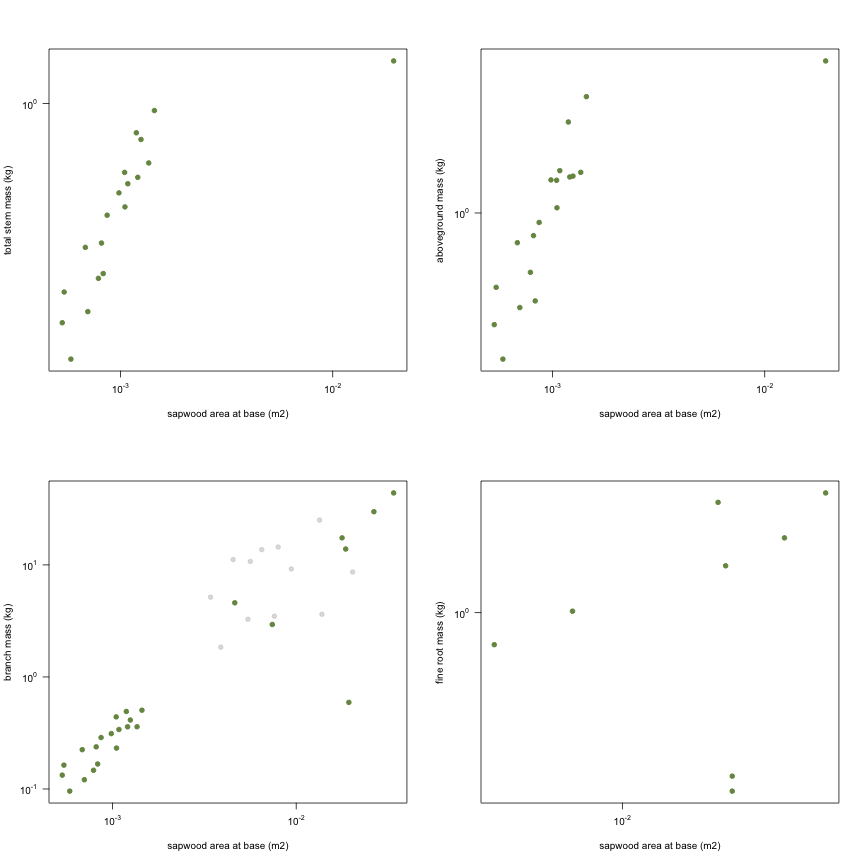
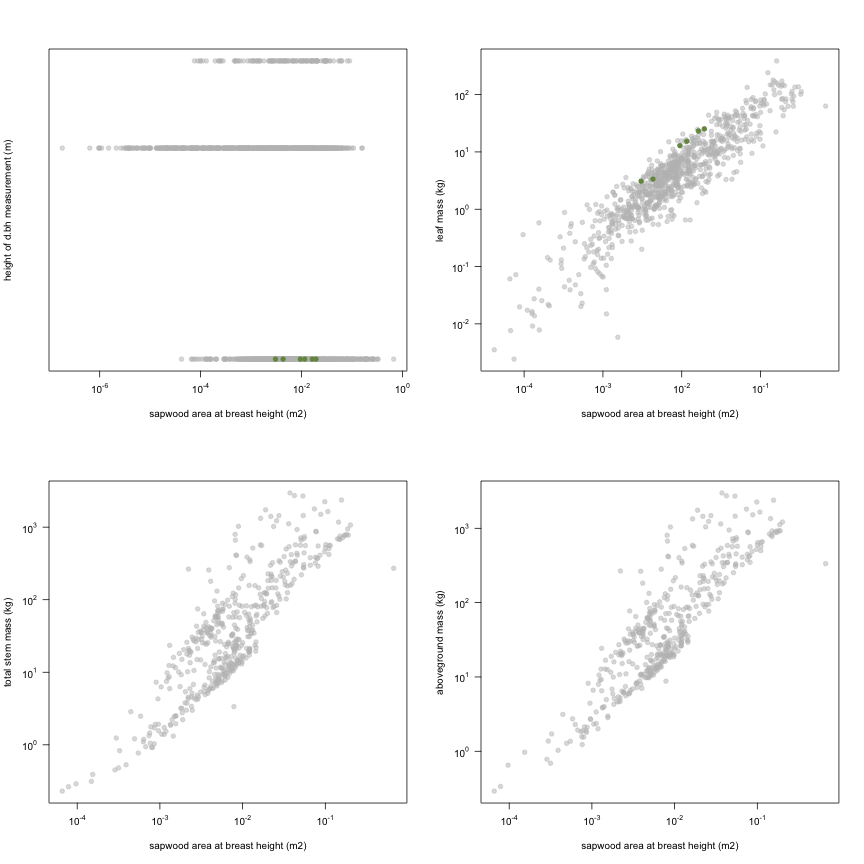
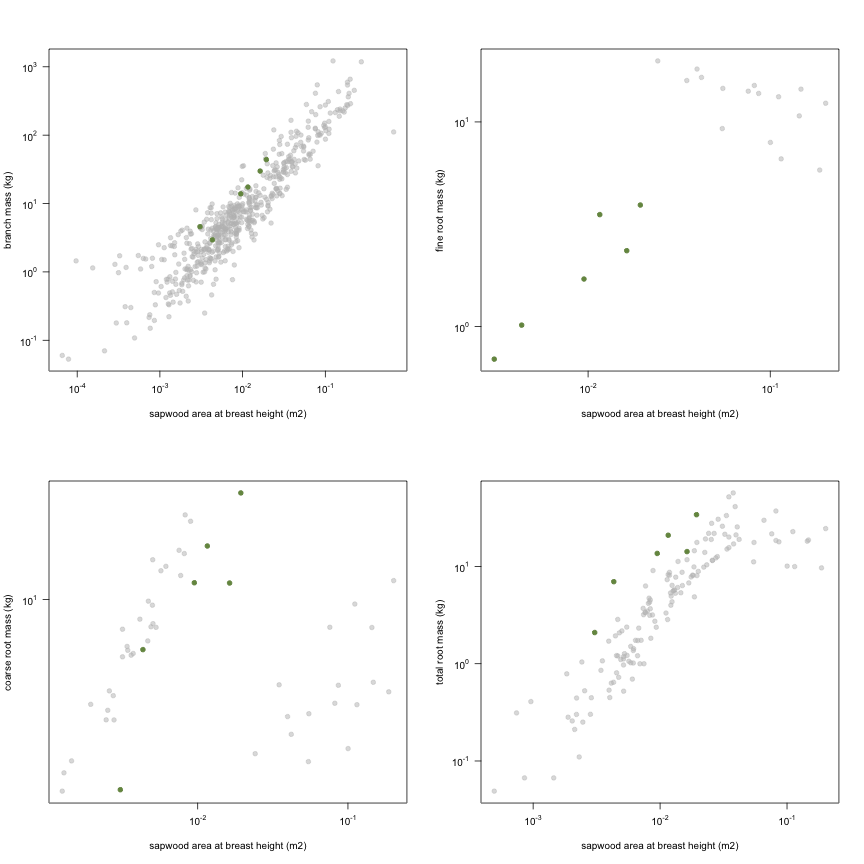
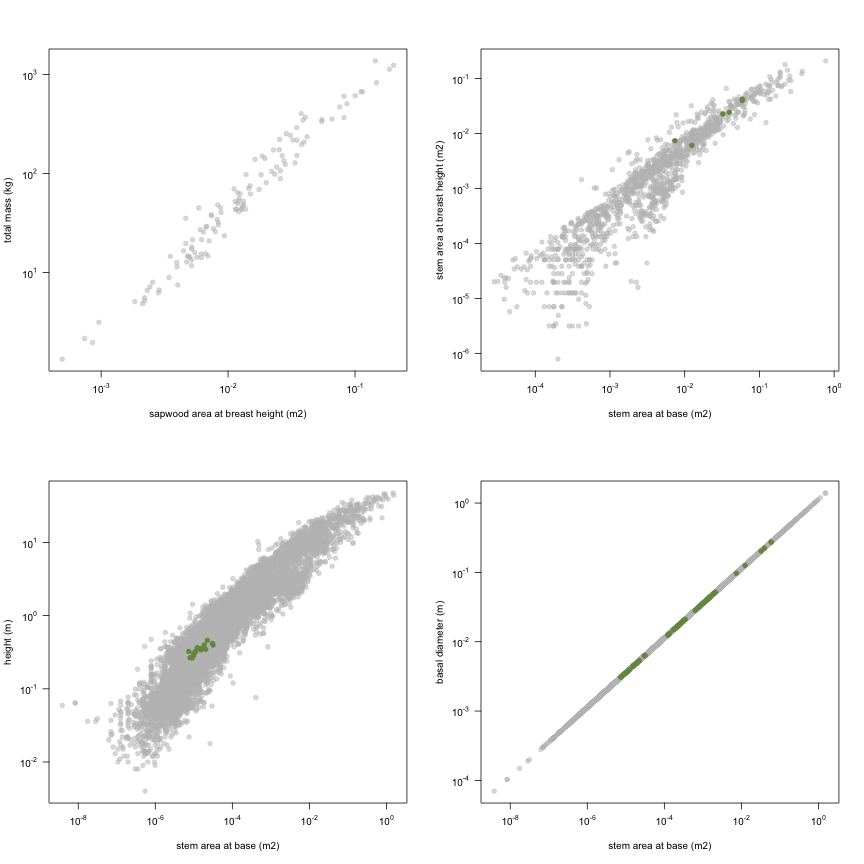
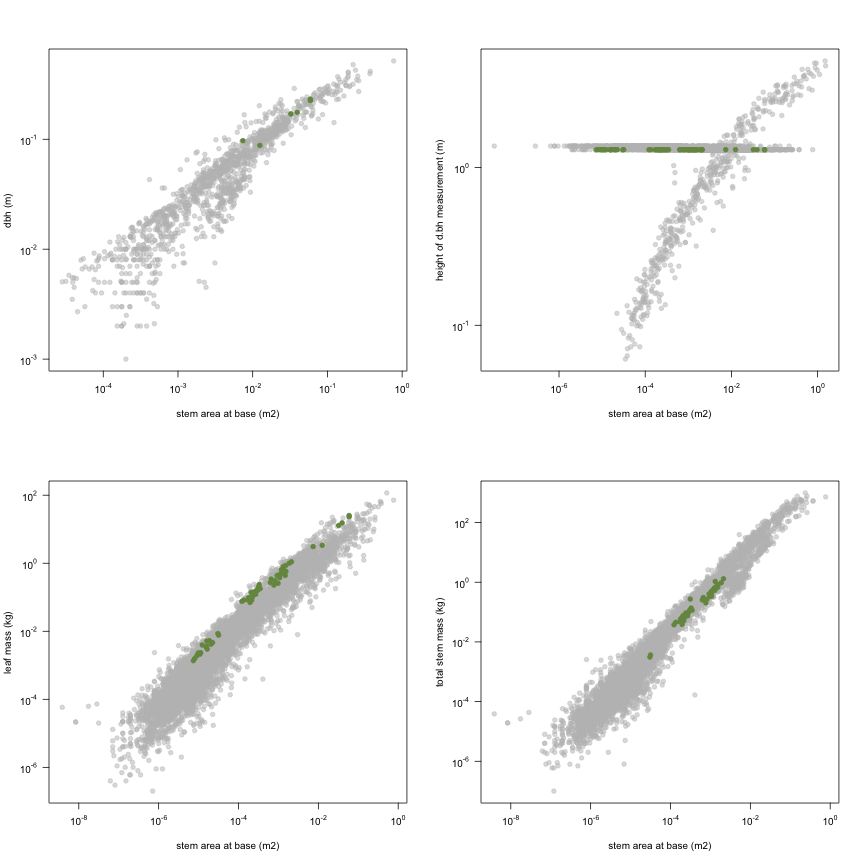
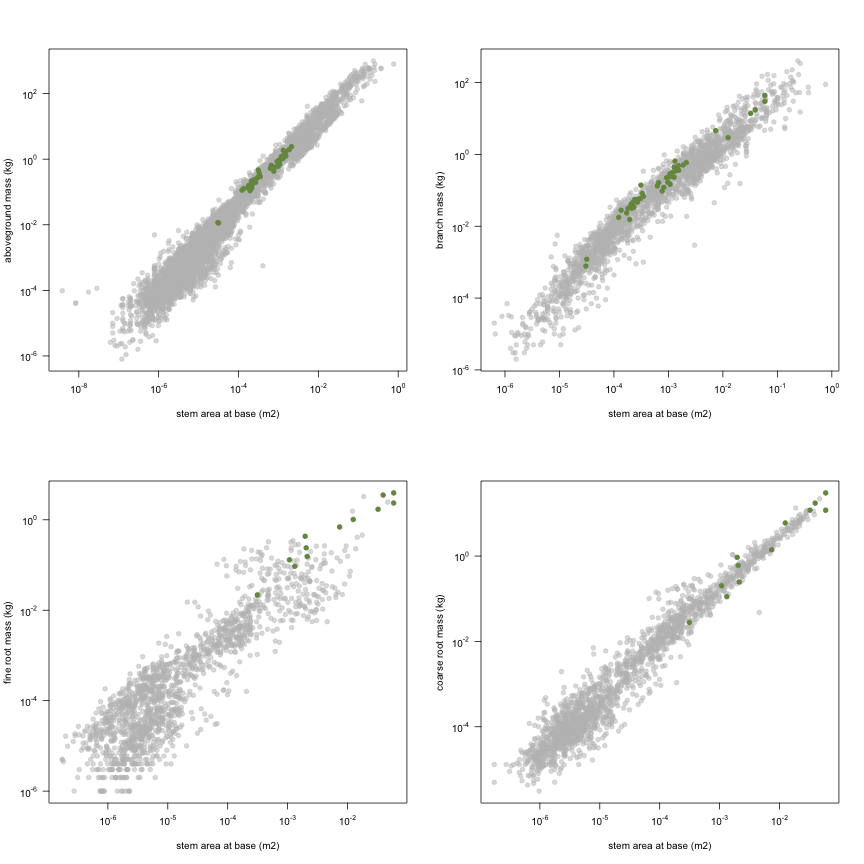
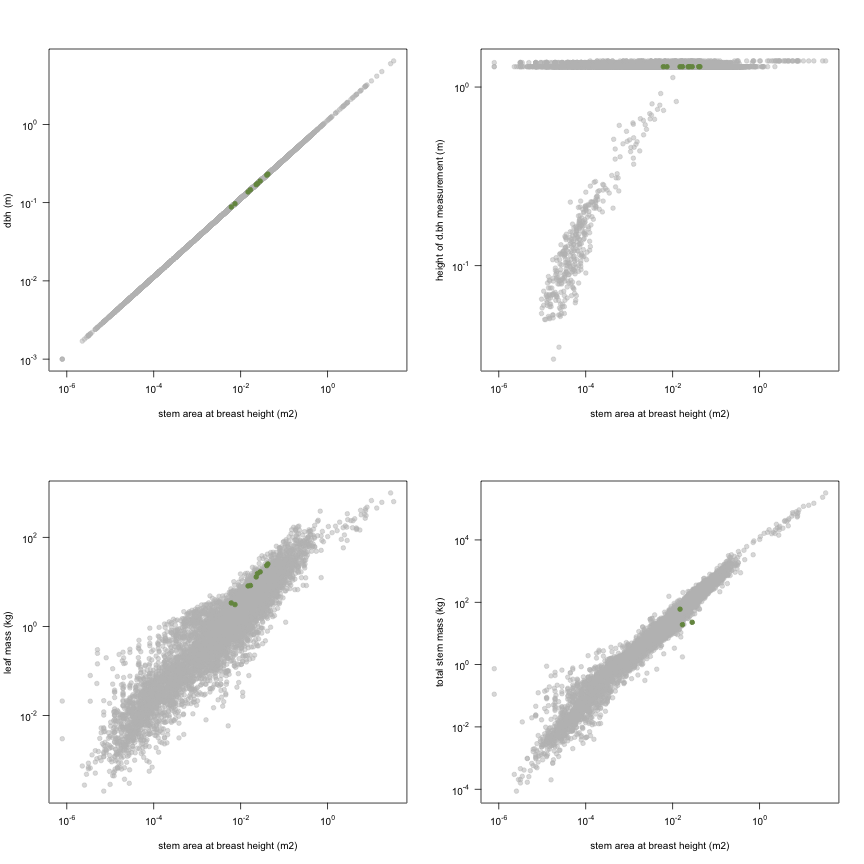
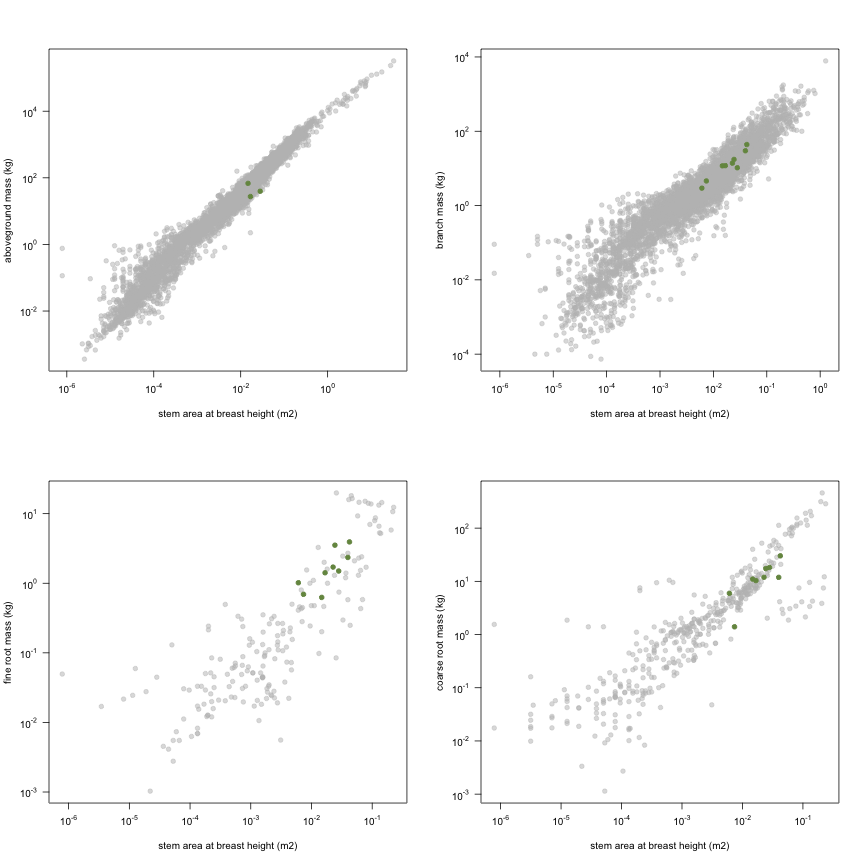
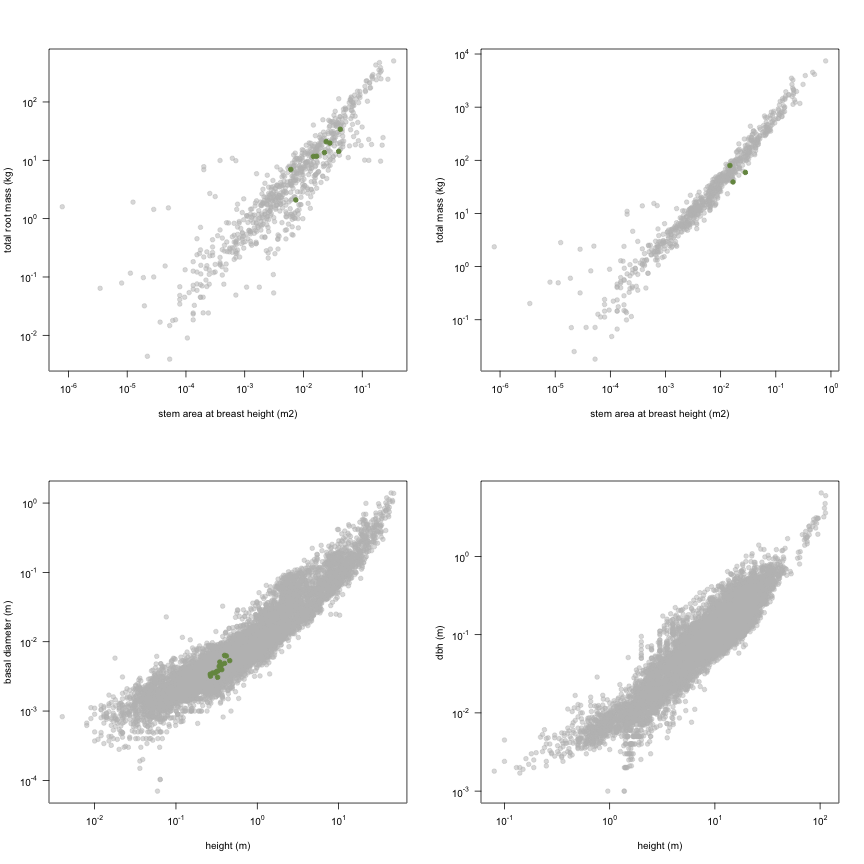
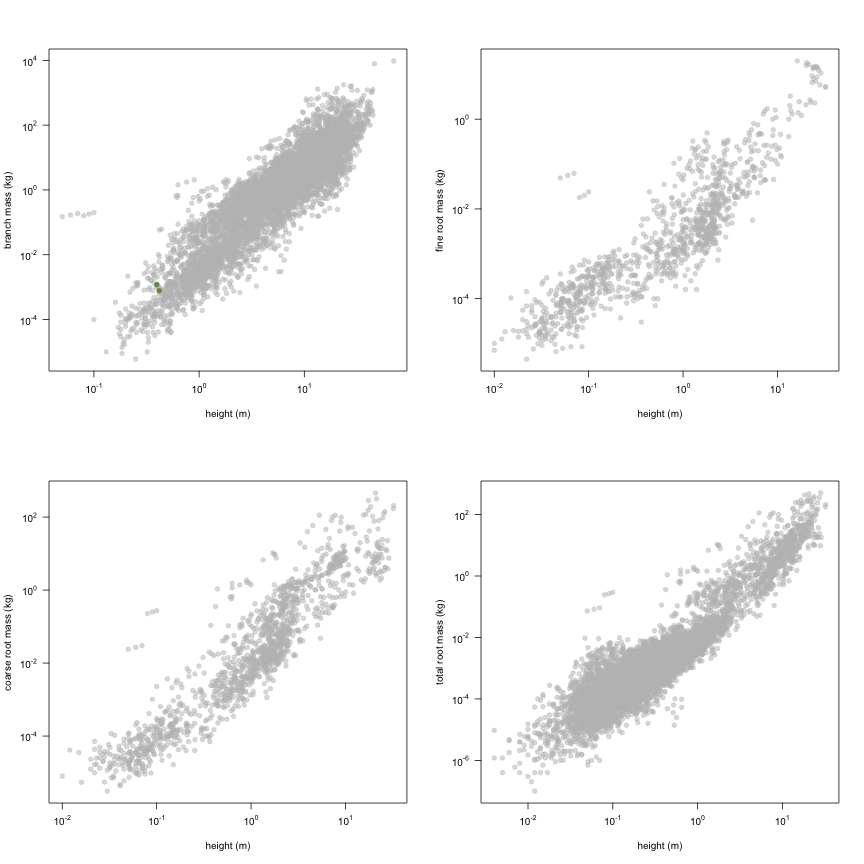
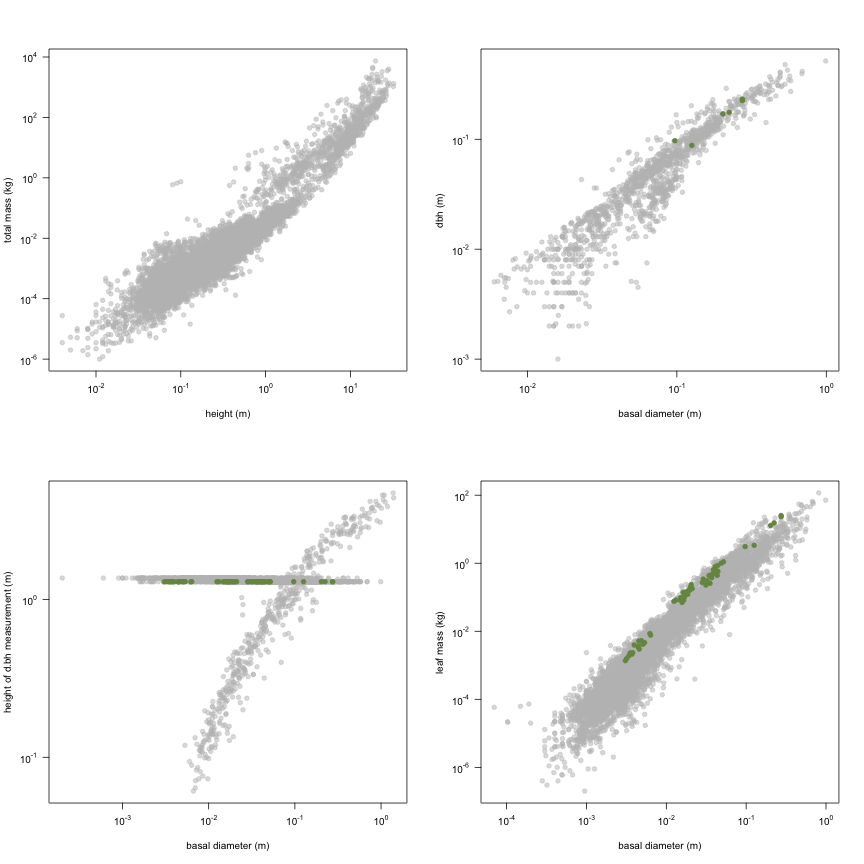
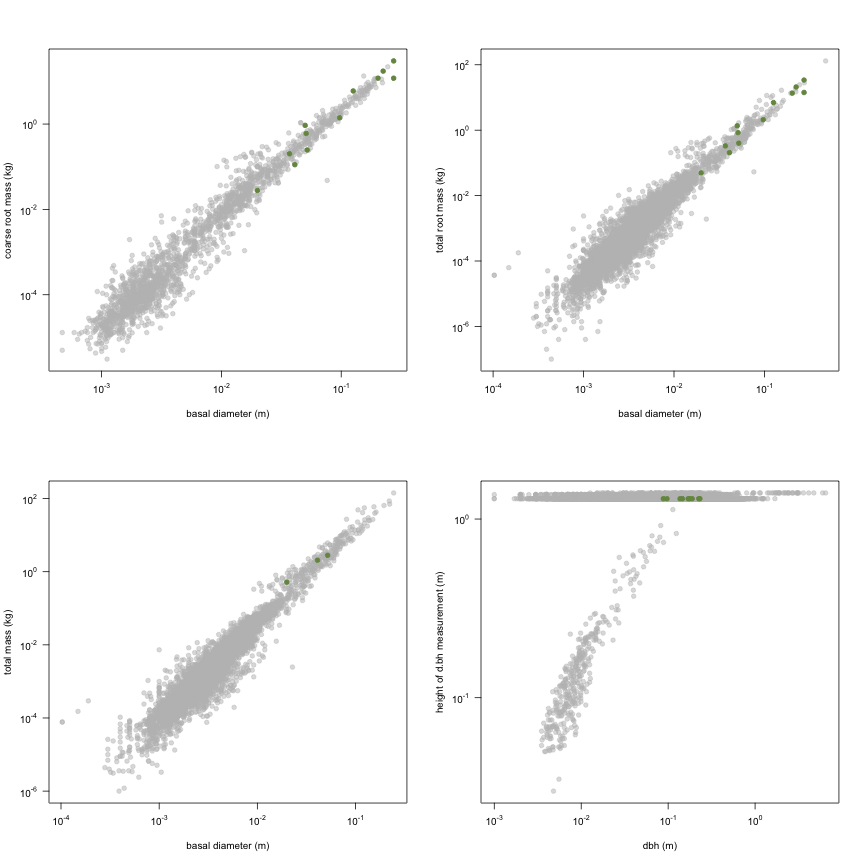
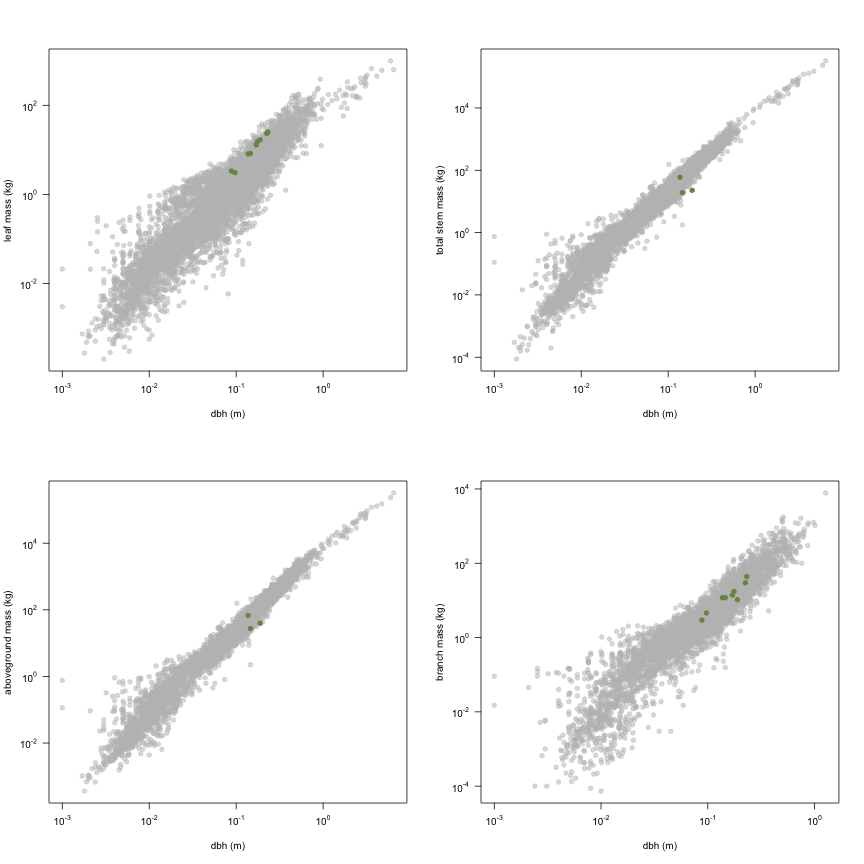
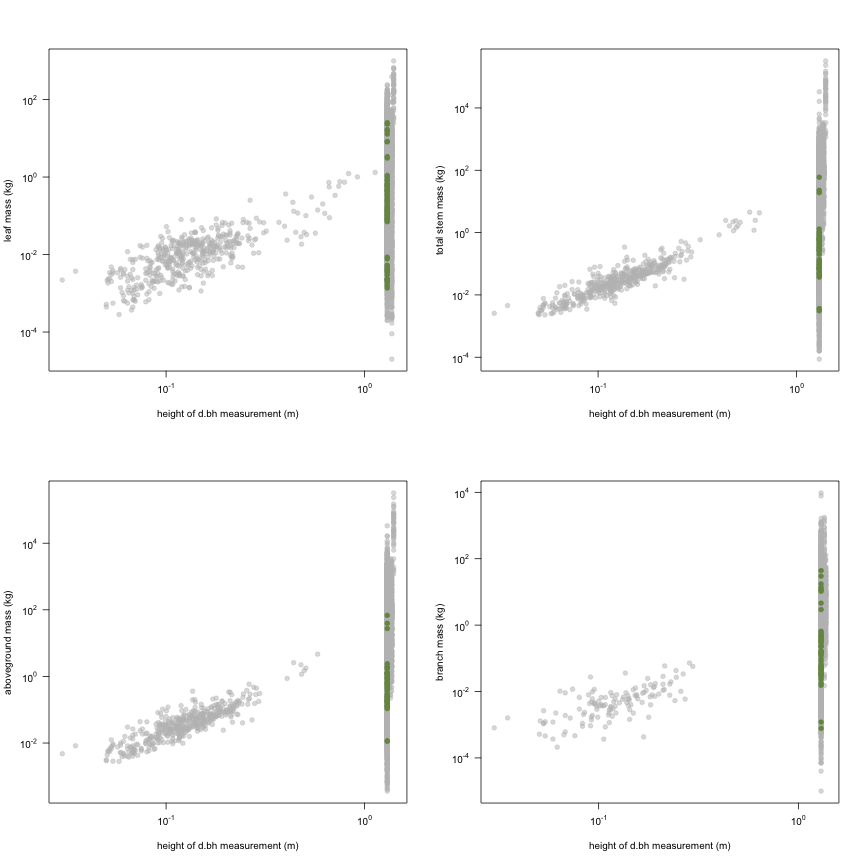
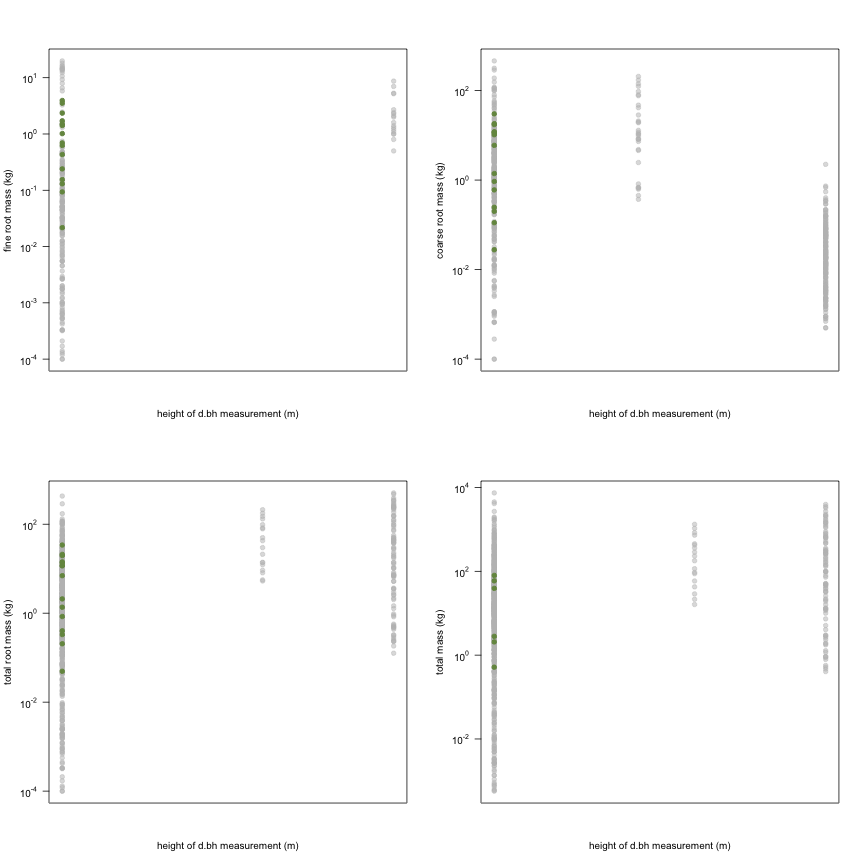
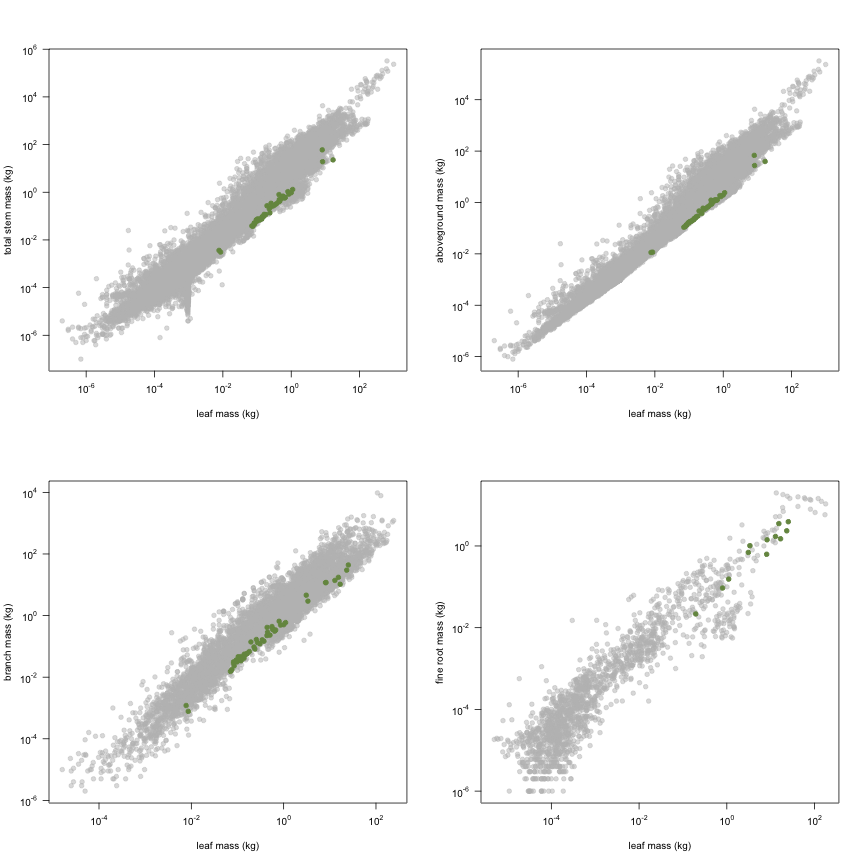
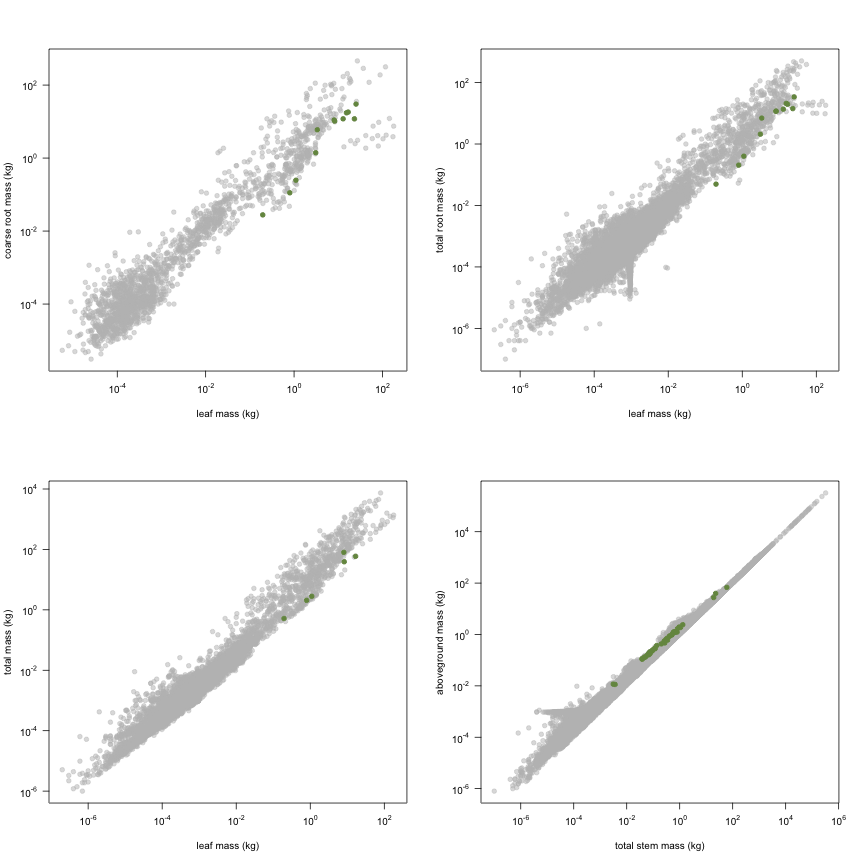
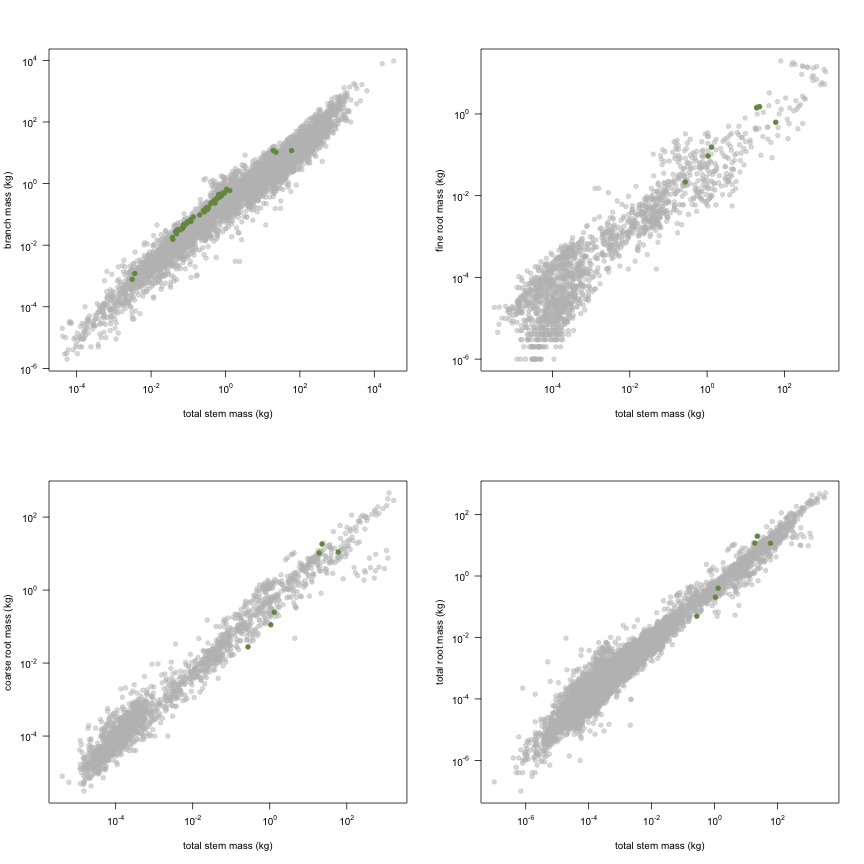
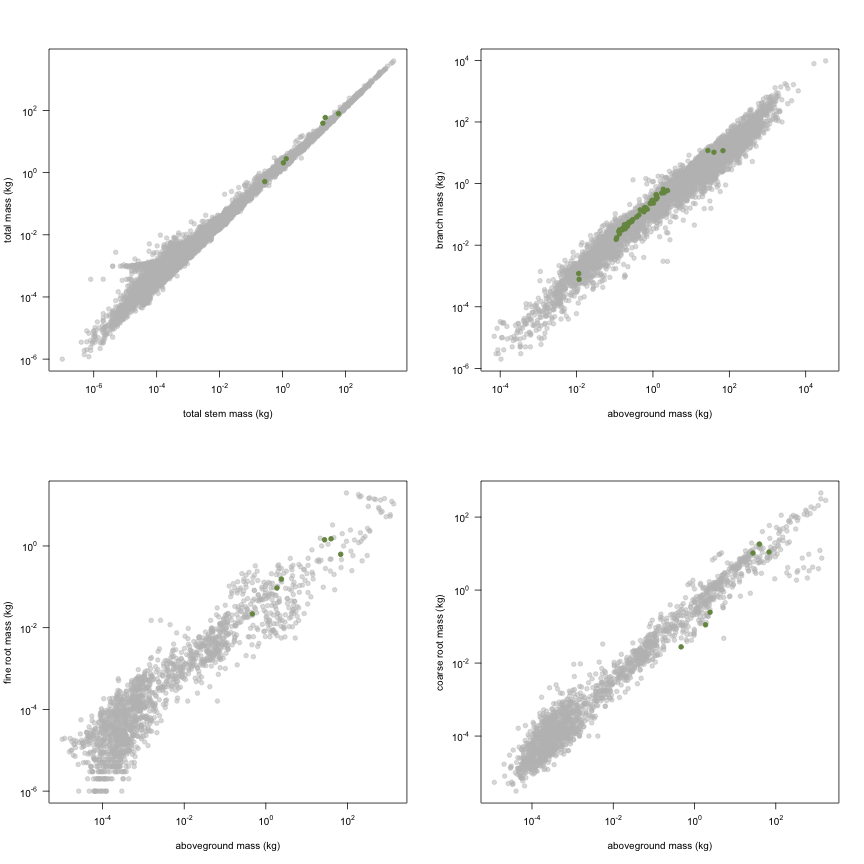
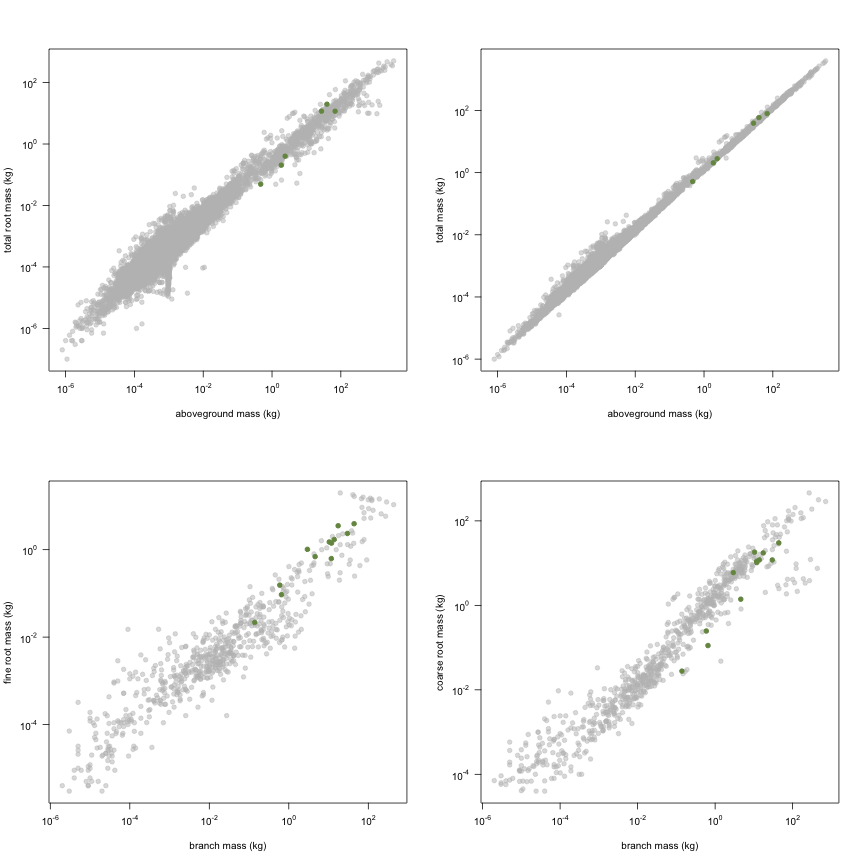
This is how the study OGrady2006 fits in the entire dataset (grey). each colour represents a species. A legend of species names with colours is included at the end for reports with 1 < n < 20 species.