An example of data monitoring setup using Evidently tool, Postgres DG and Grafana service.

You need following tools installed:
- docker
- docker-compose (included to Docker Desktop for Mac and Docker Desktop for Windows )
Note: all actions expected to be executed in repo folder.
Create virtual environment and activate it (eg. python -m venv venv && ./venv/bin/activate)
Install required packages pip install -r requirements.txt
Go to the project directory and run the following command from the terminal: docker-compose up --build
Note:
- to stop the docker later, run: docker-compose down;
- to rebuild docker image (for example, to get the latest version of the libraries) run: docker compose build --no-cache
To start sending data to service, execute:
python data_loader.py
This script will expose a single batch of calculated metrics through prometheus pushgateway every 10 seconds
- Run the example using the above instructions
- Open the Grafana web interface (localhost:3000)
- Create new Dashboard, add a Panel, and make sure you selected PostgreSQL as a source

- Customize visuals in the Grafana interface
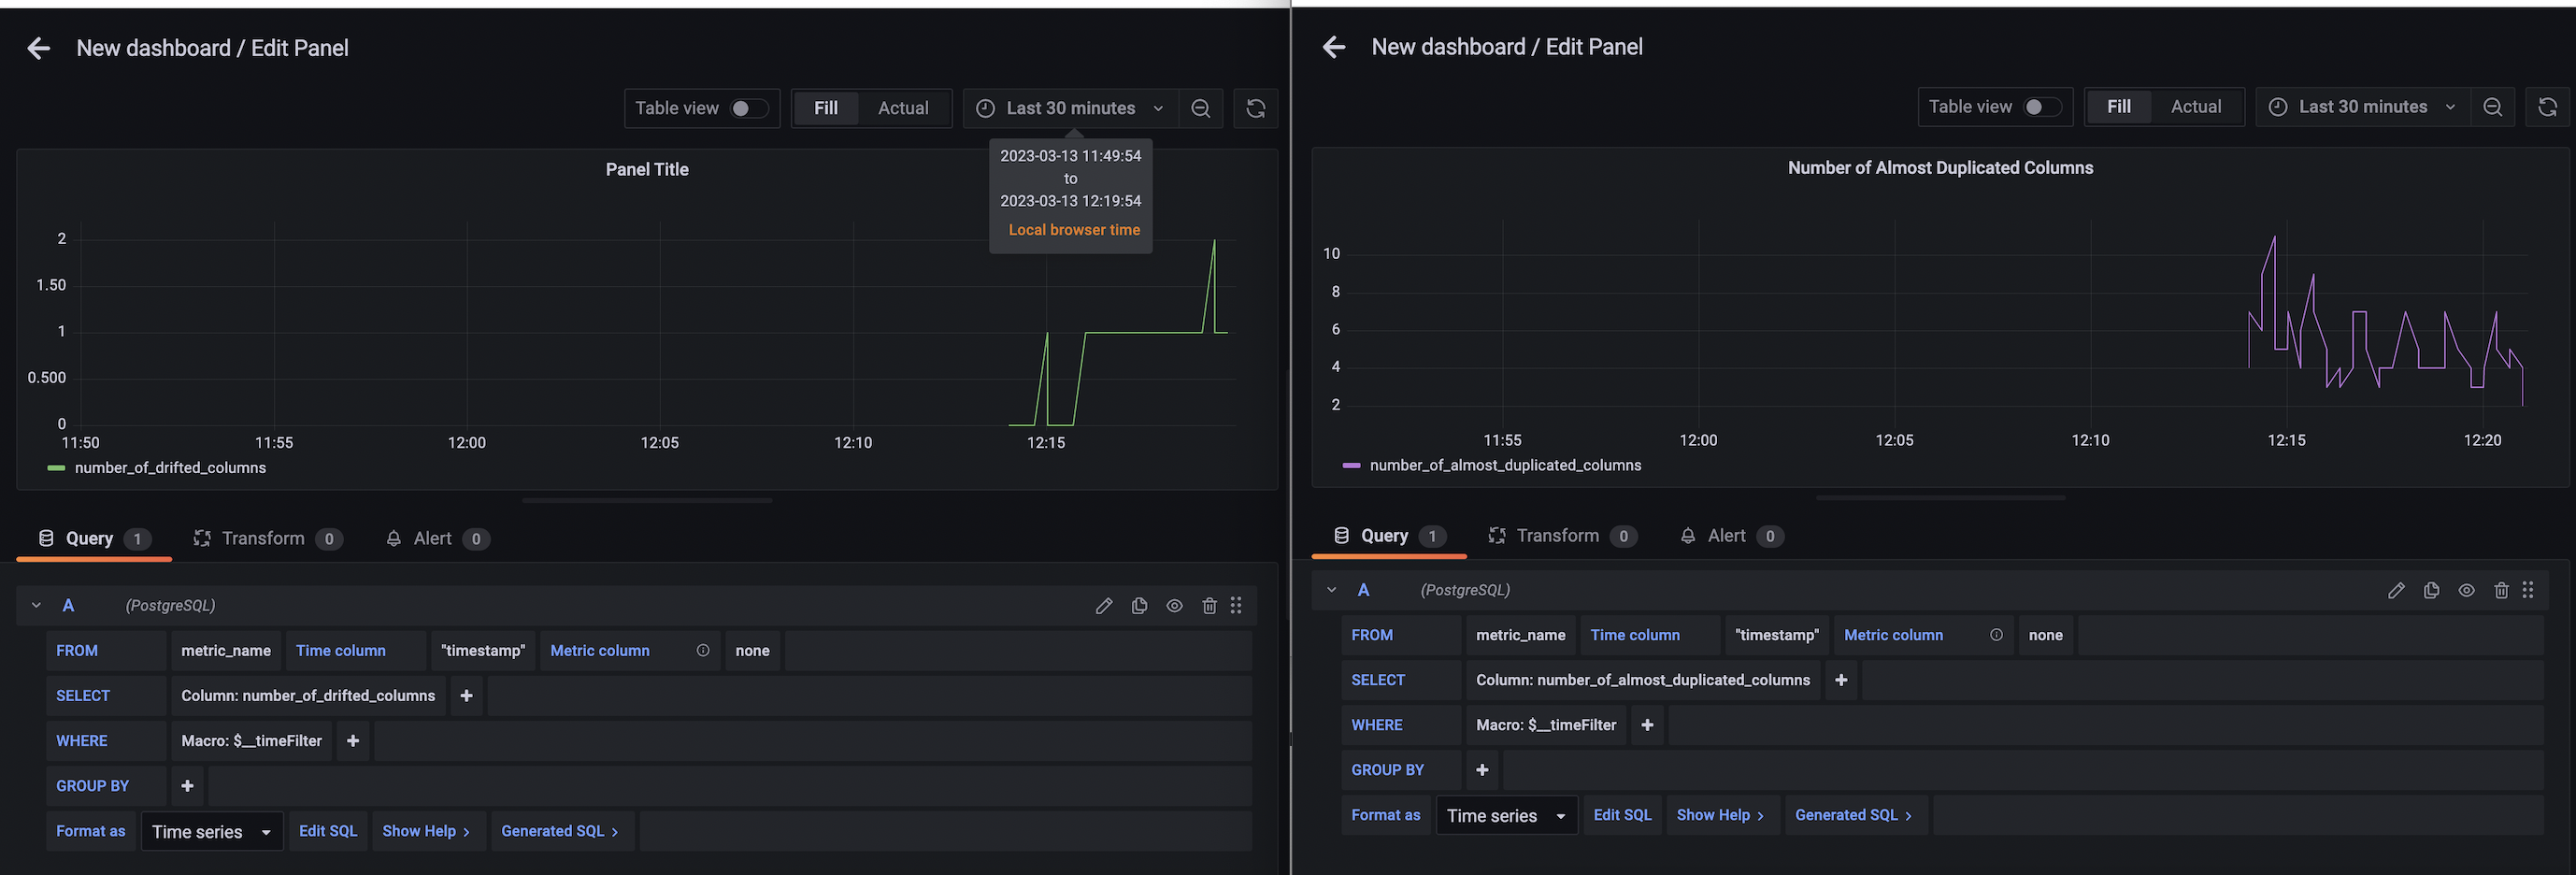
- Apply your changes to the Dashboard and check that you like what you see :)
- Click the button "save" from the Grafana Top Menu. This will open a dialog window. Select the option "Download JSON" to save the configurations in the JSON file if like to reuse it later.