Repository navigation
Grid price chart: show forecast prices differently from published prices #35505

Replies: 2 comments 3 replies

|
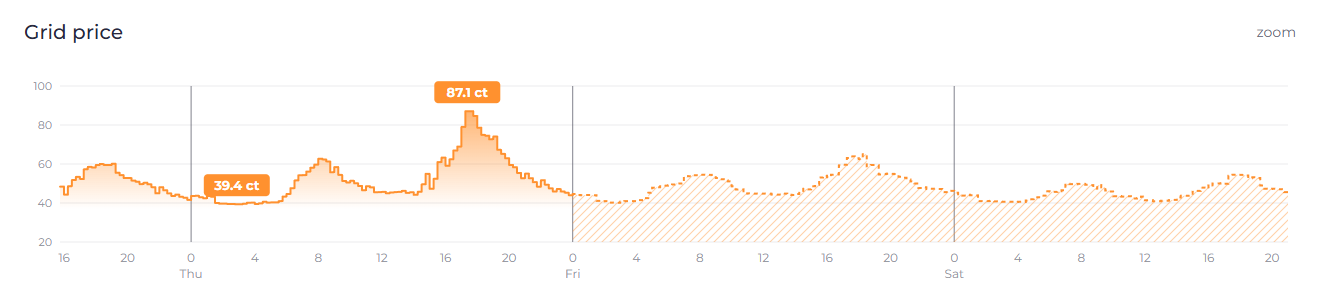
One more option I missed: the battery history chart already draws its forecast with a dashed line and a hatched area, so the price chart could simply reuse that. G: same style as the battery forecast Same data as the other mockups, with the values from I now prefer this over F. A forecast would look the same everywhere in the UI and there is no new visual style to agree on. In the code, |

|
Yes, if we decide to distinguish between different qualities/certainty-levels of forecasted data (unsure if we should, we dont have any markers for this and it's a rather advanced topic -> merged tariffs) we should reuse the existing style we already have for predicting home battery soc. |

|
Thanks. Reusing the battery style makes sense to me if this goes ahead. One catch from my test above: the hatching carries over well, but the No hurry on the "if". I'll hold off on a PR until you've decided whether this is worth having for merged tariffs. |
|
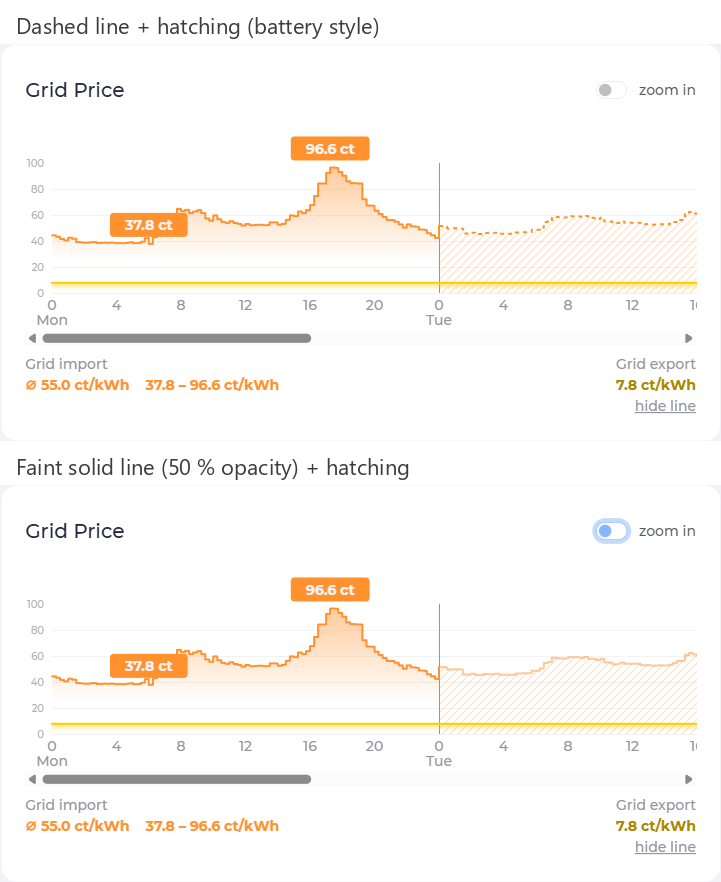
Tried the follow-up from my last comment on my instance, same real data (Tibber +
Top: battery style with This keeps the battery style where it carries over (the hatching) and swaps the dash for transparency, since a dash can't work on a step line with 15-minute slots. The battery chart would keep its dashes, they're fine on a smooth curve. Compared to G it's a two-line change on the forecast series in If you decide to distinguish forecast prices, I'd suggest this variant. Happy to open a PR against master once you give the go. |
|
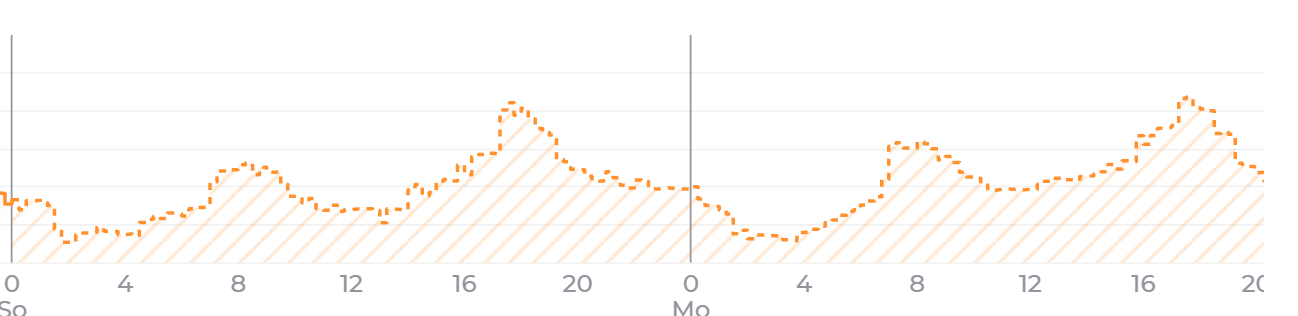
Update after running G on my own instance with real data (Tibber +
The dashed line turns choppy on a step chart. With 15-minute slots a step is only a few pixels wide, about the length of a dash, so small price changes either fall into a gap or show up as stray fragments. The battery forecast does not have this problem because it is a continuous line. The mockup above hid this. So I take back part of my preference for G. The hatched area still marks the forecast clearly, the dash pattern is what does not carry over. A solid line on top of the hatching (close to D) or a longer dash pattern may work better, I have not tried either yet. Any preference from your side before I go on? |


Uh oh!
There was an error while loading. Please reload this page.
Picking up on #35208 (comment) ("If you have an idea how we could make this 'stacked' story easier to digest happy to discuss"):
With a
mergedtariff (e.g. Tibber +epex-predictor) the forecast page draws published day-ahead prices and predicted prices exactly the same way. In the example below everything from Friday 0:00 is a prediction, but nothing in the chart says so, and the min/max labels or a tooltip value look just as certain as the real prices.Proposal
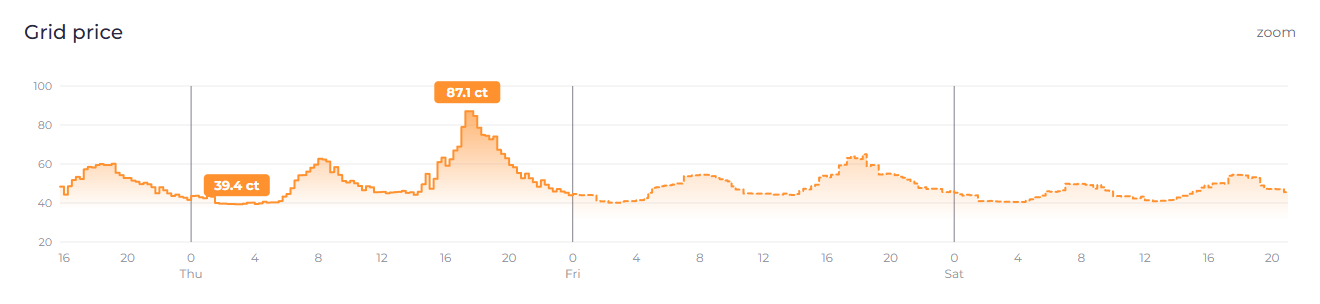
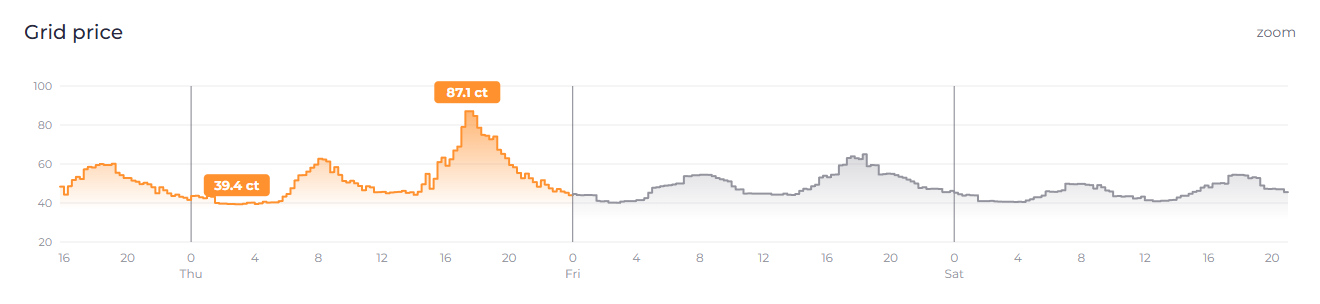
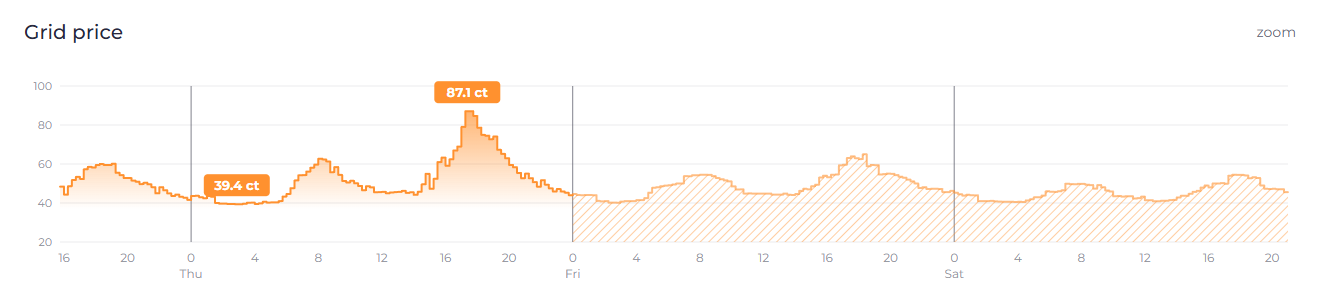
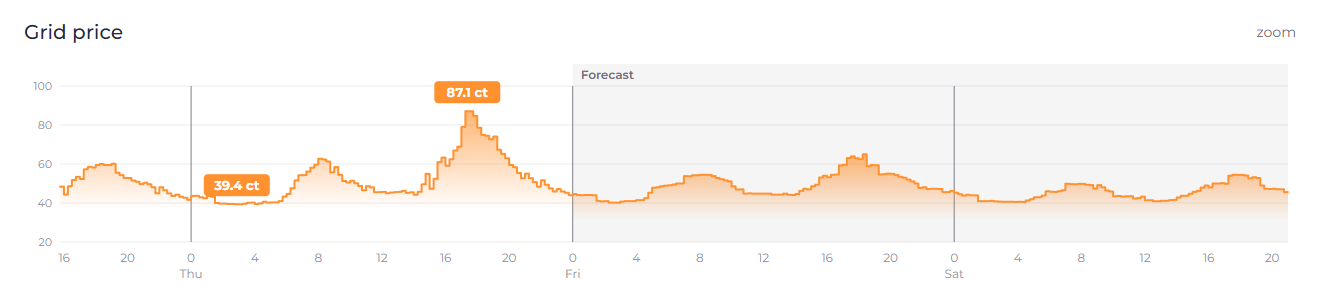
Draw the part of the series that comes from the secondary tariff differently. All mockups use the same real data (Tibber up to Thursday 24:00,
epex-predictorafter that).A: pale
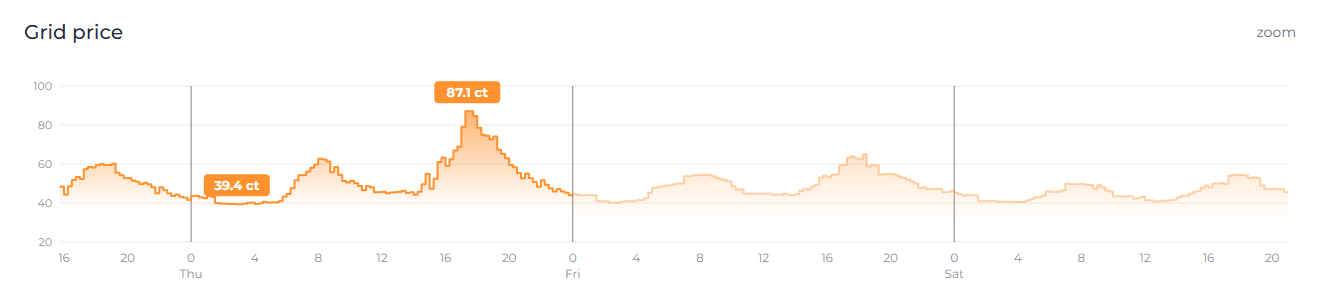
B: dashed
C: gray
D: hatched area
E: background band and label
F: combined (pale + dashed + label, tooltip says "forecast")
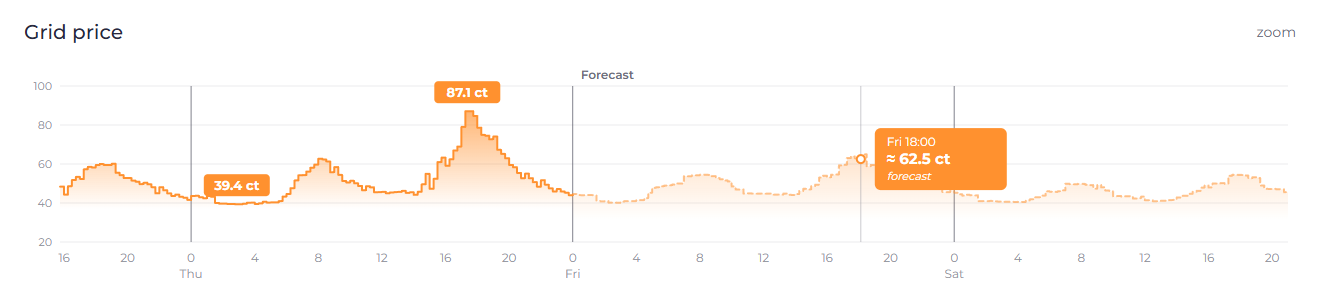
My preference is F: dashed and pale is the common way to draw a forecast, it works in dark mode and does not rely on color alone. Gray (C) clashes with grid lines and axes, which are gray already.
Implementation sketch
api.Rategets an optionalForecast bool(json:"forecast,omitempty").mergedsets it on the rates appended from the secondary tariff. Planner and optimizer ignore it.forecastRatesappends a fourth element1to those slots ([start, end, value, 1]), so older UIs keep working.PriceChart.vuesplits the series at the first forecast slot and styles the second part; the tooltip adds "forecast" (new i18n key).mergedproduces such rates today, so nothing changes for anyone without it.Open questions:
Happy to send a PR once there is a direction.
All reactions