Simple heart rate monitor with arduino for my school project
First of all, let's start by getting to know the Pulse Heart Rate Monitor, one of the most important materials of our project. Pulse Heart Rate Monitor is a sensor that can be easily fixed to your fingertip or ear to measure your heart rate. It is possible to supply this sensor with 3V or 5V. Thanks to the noise canceling circuit on it, you can get a clean and stable measurement.
The working principle of the Pulse Heart Rate Monitor is as follows: The sensor measures how much of the light it sends to your fingertip or ear is reflected, and gives an analog value between 0 and 1023 over the signal pin. This value rises during the heartbeat and then falls again. The code we will write to the Arduino uses these changes to measure our pulse rate per minute.
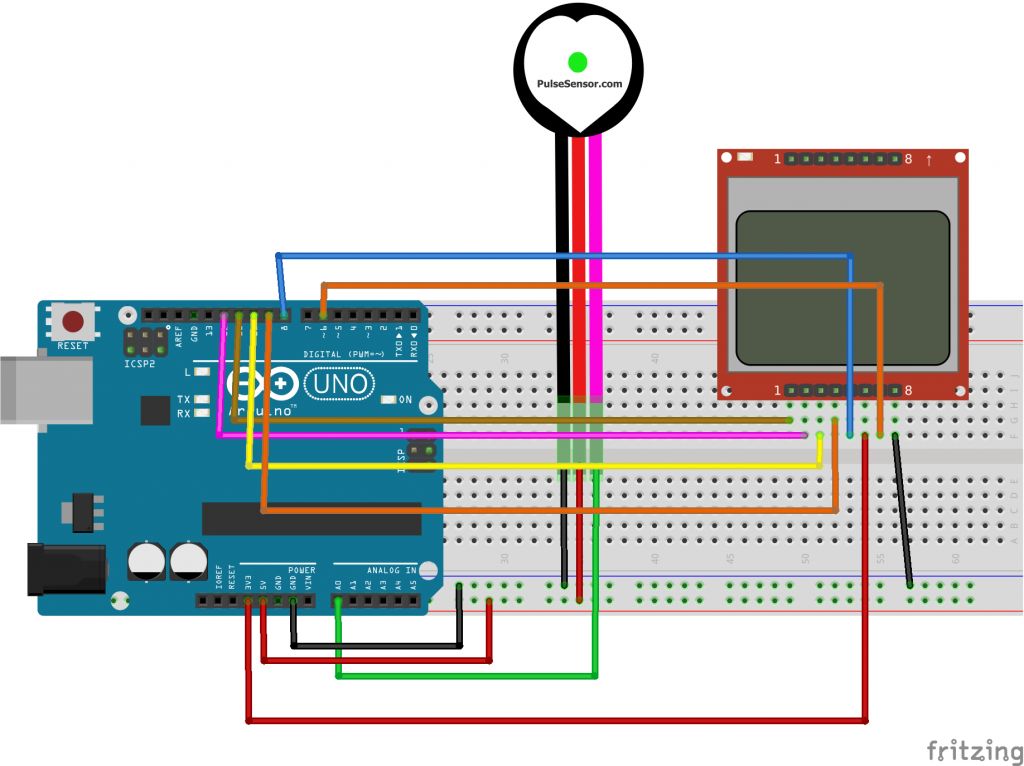
Our project will consist of two parts. In the first part, we will make the connection between the Pulse sensor and the Arduino. After successfully completing this part, we will reflect the heart rate value we obtained to our 5110 screen. Let's start with the first part.
From the options above, we must click on the "Tools" option and then click on the "edit libraries" option. After this process, the tab called “Library Manager” will open. From here, what we need to do to install the required library is to write "pulse sensor playground" in the search section, select the most recent version from the "select version" section and press the "Install" button.
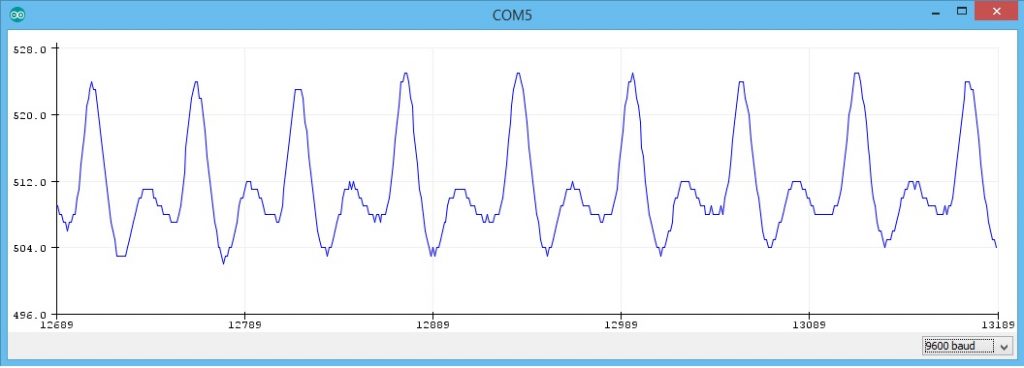
Now that we have successfully installed the required library, we can move on to the next step. As I explained in the above section, Arduino decides whether or not the pulse is realised, according to the size of the analog value coming from the sensor. Therefore, we need to set a threshold beforehand. In this way, the Arduino will be able to understand that the pulse is occurring when a signal is above the threshold value we have set. In order to determine the threshold value, we need to see the values from the sensor. The easiest way to do this is to use one of the sample codes in the library we have downloaded. In order to open the required sample code file, we click File>Examples>Pulse Sensor Playground>GettingStartedProject options respectively. Then, we upload the code opened on the screen to our Arduino. Now we click on Tools>Serial Plotter to view the incoming signals on our computer. On the screen, you will see that a line is formed in the light of the data from the sensor. Now all you have to do is place your fingertip on the sensor. Now you should see waves appear on the screen as in the image below. If that's the case then everything is going well and we can move on.
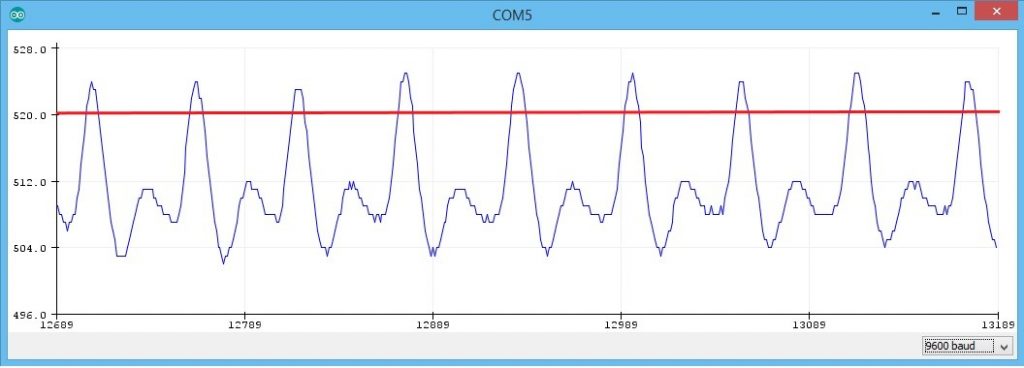
The next step is to determine the threshold value based on the graphic on your screen. For this, we need to set such a value that the rises in the chart should go above this value, but the parts other than the rises must remain below this value. For example, in the image below, 520 is an appropriate threshold. But you should determine your own value according to the graphic on your screen because it may differ.


