blue imaging
Examples... Crater Resolution...
This page is inspired by a question from Bob Pilz on the Yahoo! Lunar Observing group. Essentially the question is:
If one has a reflecting telescope with a certain wave rating (a measure of the distortion in the optics) evaluated at 530 nm (a green wavelength), can one detect smaller craters on the Moon by operating it at 450 nm (a blue wavelength) or at 780 nm (an infrared wavelength), assuming an idealized world in which seeing and exposure time play no role?
The answer is not obvious because although the diffractional blur decreases as the wavelength is decreased, the wave rating gets poorer (the wave rating refers to fixed errors in the figure of the mirror(s), evaluated in waves at the reference wavelength) . Since a larger wave rating sounds like poorer performance, this seemed to suggest that as the wavelength was decreased the increased blur due to the poorer wave rating would overtake the decreased amount of diffraction leading to poorer overall performance. This is simply not true.
Earlier responses by me and by Tony Gondola (a New Mexico-based optician) may have perpetuated this myth. Based on simulations with Cor Berrevoet's excellent, but thinly documented and somewhat quirky, Aberrator program, we both said that under certain circumstances photos taken with a blue filter would be blurrier than those taken with a red one.
Classical optics has traditionally been divided into two somewhat awkwardly joined camps: geometrical optics which deals with the errors in optical systems that can be determined by tracing rays according to the ancient rules of reflection and refraction; and physical optics which deals, among other things, with the much later discovered tendency of light to spread laterally when it passes through a constricted opening (an effect called diffraction). The analysis of optical systems typically consisting of using ray tracing to determine the gross structure of the image (including the distribution of phase and intensity over the so-called wavefront) and Fourier analysis to translate that distribution into how it will actually appear when viewed as an image in the presence of diffraction.
Because wavelength does not enter into the ray-tracing part of the analysis for a reflecting system, the geometric contribution to the image (which is what the wave rating mentioned above refers to) leads to a fixed angular blur in the sky (unchanging with wavelength). Superimposed on this is the diffractional blurring around each ray whose magnitude is directly proportional to the operating wavelength (increasing blur with increasing wavelength) and inversely proportional to the telescope aperture (decreasing blur with increasing aperture). As a result of the proportionality to wavelength, no matter how large the geometric blur may be there is always some wavelength at which the diffractional blur will grow larger than it. This might be termed the "diffraction limited" regime, and at still longer wavelengths the diffractional blur will increasingly dominate so that the overall blur will begin to increase in direct proportion to the wavelength. On the other hand, if the wavelength is decreased beyond the point at which the diffractional and geometrical blurs are about equal, the diffractional blur will become insignificant, but the overall blur cannot decrease below the fixed geometric limit even if the diffraction went to zero. This short wavelength end might be termed the "geometrically limited" regime, and in this regime, the angular blur has a fixed small value independent of wavelength.
As a consequence of this logic, one can see that decreasing the operating wavelength of an all reflecting telescope can improve its angular resolution (a steady linear improvement if it is operating in the "diffraction limited" regime), or it can have little or no effect on the resolution (once the operating wavelength has bee decreased into the "geometrically limited" regime). But decreasing wavelength, since it is diminishing one of the two effects (diffractional blur) while leaving the other (geometric blur) unchanged, can never cause a decrease in resolution.
As will be shown in the following, the reason for the erroneous conclusion that with sufficiently larger aberrations things could "go bad in the blue" was due to a misunderstanding of the operation of the Aberrator software. In particular, dialing in values for the so-called "spherical aberration" without realizing that the blur being displayed was not at the best possible focus.
The only version of Aberrator that the current author was able to get to work on his PC was the V3.0 Beta (7 March 2001). This version does not have an explicit wavelength control. In fact the program is not actually doing a full simulation of an optical system, but rather is simply computing the point image that will appear in the focal plane due to an assumed wavefront error pattern over a circular aperture (which can be viewed with the Wave button at the top of the screen). The details of the so-called point spread function are computed from this using a 512x512 Fast Fourier Transform. The precise circumstances of how the phase pattern was produced, including the wavelength, are largely irrelevant, although it seems to be using a fixed value of around 550 nm (nanometers). The beauty of the program is that it can convolve the computed point spread function with an actual image to estimate what it would look like when sampled using this degraded resolution pattern.
Like the system in Bob's question, the phase errors in the wavefront are specified in terms of waves of error. To simulate the effect observing with a given telescope at different wavelengths the available parameters can be manipulated in the following way:
-
The diffractional blur is directly proportional to the wavelength and inversely proportional to the aperture. Since Aberrator operates at a fixed internal wavelength, the effect of increasing the observing wavelength is the same as decreasing the observing aperture in the same proportion. Hence if we start somewhat arbitrary with a mirror diameter of 100 mm, and take the blur to represent the blur at 530 nm, the blur at 450 nm will be the same as the program would predict for a 100x530/450 = 118 mm mirror, while that at 780 nm is the same as it would predict for a 100x530/780 = 68 mm mirror.
-
The geometric errors in the system (the "wave rating") refers to fixed "millimeter" errors in the mirror. When expressed in waves, their magnitude is inversely proportional to the reference wavelength used for the measurement. A mirror that has a wave rating of 1-wave when operated at 530 nm will have a rating of 1x530/450 = 1.18-waves when operated at 450 nm. The same mirror operated at 780 nm will have a wave rating of 1x530/780 = 0.68-waves.
Note that 1.18 waves (at the Aberrator operating wavelength) over 118 mm corresponds to the same surface slopes as 0.68 waves (at the Aberrator operating wavelength) over 68 mm. That is, these correspond to same physical piece of glass, producing the same angular geometric deviations. Artificially changing the mirror diameter from 118 to 68 simulates (at the Aberrator operating wavelength) the difference in diffraction for the actual physical mirror (of a fixed diameter) operating at the two wavelengths.
Also note that Aberrator V3.0 Beta actually does contain a wavelength control under Tools. However this control has no effect on the Spot or Planet functions that were used here. Instead, in that window one can select one or multiple wavelengths for the generation, under Chroma, of a full color point spread function obtained by summing the monochromatic results at the individual wavelengths.
As a result of these considerations, the simulations were performed using the following parameters:
Table 1 : Parameters Used in Simulations
| Simulated Wavelength | Simulated Errors at 530 nm | Aberrator Wavelength | Aberrator Mirror Diam. | Aberrator Surface Errors |
|---|---|---|---|---|
| 450 nm | 0.25 waves | 550 nm? | 118 mm | 0.30 waves |
| 450 nm | 1.00 waves | 550 nm? | 118 mm | 1.18 waves |
| 780 nm | 0.25 waves | 550 nm? | 68 mm | 0.17 waves |
| 780 nm | 1.00 waves | 550 nm? | 68 mm | 0.68 waves |
The wave errors are peak-to-valley (extreme to extreme) values in the wavefront as verified in the Aberrator Wave display. The focal ratio of the system was left at the default value of f/10, although this and the wavelength at the other settings really have no effect on the results other than in determining the scale of the output pattern, whose shape and structure is determined solely by the phase pattern over the 512x512 Fourier grid. As a result, the simulations can be thought of as applying equally to any system diameter whatsoever, and to any set of wavelengths separated by the same ratios, provided that the aberrations are at the stated values at those wavelengths.
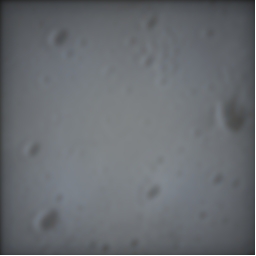
The Planet function of the Aberrator software combines an idealized image with the computed point spread function to estimate the appearance of the actual aberrated process. Although the exact details are not disclosed in the documentation, the process by which this achieved is presumably essentially equivalent by setting each pixel in the final image to an average of its surrounding pixels, selected and weighting them according to the intensity in the point spread function. The test image to which the computed point spread function was applied is cropped from Apollo 15 metric camera frame AS15-M-1699:

Shown in the following tables are the computed point spread functions and the resulting image blur for the various aberration patterns provided by the Aberrator software. Since the lunar surface has a similar mix of features of varying sizes at any scale, the exact scale of the both the point spread functions and the reference image are unimportant as long as they are always the same: what is important is the relative amount of blur in the different situations. A small telescope with the stated wave errors operating between these two wavelengths will have exactly the same relative difficulty detecting a distribution of large craters as will a large telescope with the same wave errors trying to distinguish a distribution of small craters at the same two wavelengths.
Note that all the point spread functions are shown at the same angular scale on the sky, and all the simulated images are likewise shown at a uniform scale. However, the software has some unexplained magnification controls which are a bit hard to understand, so I can't guarantee that these two scales are the same. The point spread function effectively acts as a sampling mask that is placed over the input image. The point spread patterns shown are correct and comparable, but they may be systematically larger or smaller than the mask actually applied to the image.
The Aberrator software lists five primary aberrations patterns describing geometric errors in the wavefront. These are: focus, coma, astigmatism, 3rd order spherical aberration and 5th order spherical aberration. In the examples, each aberration was investigated individually, with the others (except in selected cases of spherical aberration) set to zero. As noted below, the pattern called "spherical aberration" produces an initially very poor result that can often be greatly improved by empirically adjusting the focus.
A final quirk of the software: sometimes Aberrator v3.0 produces an incorrect (overly blurred) simulated image the first time the "Calculate" button is clicked, but it always seems to be consistent after the second click. The results shown here are those obtained after two clicks of the "Calculate button" (the check marks in the Aberrator output windows).
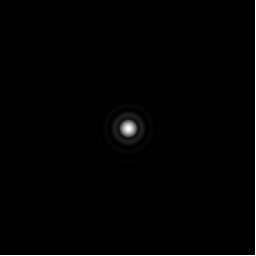
The first examples show the performance of a perfect telescope of fixed size operating at the two wavelengths. The angular blur comes entirely from the diffraction which is in turn related to the size of the aperture in relation to the operating wavelength. Since 780 nm is 1.73x larger than 450 nm, the Airy disk, and the rings around it, are 1.73x larger at 780 nm and hence the image blur is larger by that same factor. This clearly makes the smaller craters in the mix harder to detect at 780 nm.
Table 2: No Aberrations
| Performance at 450 nm | Performance at 780 nm | ||
|---|---|---|---|
| Point Spread Function | Image | Image | Point Spread Function |
 |
 |
 |
 |
The second set of examples makes the same comparison, but with the diffractional blur augmented by the fixed angular blur associated with a mirror whose surface is rated at 530 nm as having 0.25-waves (peak to valley) of errors in the stated patterns.
Table 3: 1/4 wave Peak-to-Valley Wavefront Error at 530 nm
| Performance at 450 nm | Performance at 780 nm | |||
|---|---|---|---|---|
| Aberration | Point Spread Function | Image | Image | Point Spread Function |
| Focus error |  |
 |
 |
 |
| Coma |  |
 |
 |
 |
| Astigmatism |  |
 |
 |
 |
| 3rd Order Spherical | 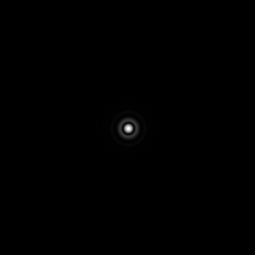 |
 |
 |
 |
| 5rd Order Spherical |  |
 |
 |
 |
It will be observed that in every case the point spread function deviates only slightly from a perfect one, and is distinctly larger at 780 nm than at 450 nm. As a result, the image blur is less, in the blue (450 nm) than in the red (780 nm). This telescope is operating well within the "diffraction-limited" regime for each aberration considered here.
In the final set of examples, the amount of geometric imperfection in the system is increased to four times what it was in the previous table. It is now 1 wave as rated at 530 nm.
Table 4: One wave Peak-to-Valley Wavefront Error at 530 nm
| Performance at 450 nm | Performance at 780 nm | |||
|---|---|---|---|---|
| Aberration | Point Spread Function | Image | Image | Point Spread Function |
| Focus error |  |
 |
 |
 |
| Coma |  |
 |
 |
 |
| Astigmatism |  |
 |
 |
 |
| 3rd Order Spherical |  |
 |
 |
 |
| 3rd Order Spherical with focus correction |
 |
 |
 |
 |
| 5rd Order Spherical |  |
 |
 |
 |
| 5rd Order Spherical with focus correction |  |
 |
 |
 |
Because the predicted point spread functions differ greatly from the classic Airy pattern -- with distorted shapes and light being transferred from the central disk to the outer rings -- the exact effect that each will have on the sampled image is harder to anticipate. For focus, coma, and astigmatism, the size of the patterns at the two wavelengths is nearly the same, so there is little difference in the resulting image blur. The telescope is operating in the "geometrically-limited" regime for these aberrations: because the blur is dominated by the fixed ray-tracing errors, diminishing the diffractional contribution (by reducing the operating wavelength) has little effect. For the two forms of spherical aberration, the initial result seems to show that the point spread function is larger, and hence the image more blurred, in the blue. However, a little trial and error shows that Aberrator has not placed the focal plane at the so-called "circle of least confusion". At both 450 and 780 nm the tightness of the point spread function can be greatly improved by adjusting the focus. Since a real-world imager would intuitively adjust the CCD to this optimum point, this is the performance that would actually be observed. In the computed this required focus offsets of -2.1 waves to compensate for the 3rd order spherical aberration at 450 nm, and -1.1 waves at 780 nm. For the 5th order aberration, -1.0 waves was used at 450 nm, and -0.3 waves at 780 nm. After these corrections are made, the point spread function, and hence the blurring, is significantly smaller at 480 nm. This telescope, which was in the "geometrically-limited" regime for the first three aberrations is in the "diffraction-limited" regime for these last two.
This result is consistent with optical design texts which state that spherical aberration can be reduced by a factor of about four by an adjustment of focus; and this explains my spherical aberration went from being the most critical aberration in the earlier (erroneous) posting to the least critical here. Interestingly, the official peak-to-valley wavefront error is much larger after the focus correction has been made, but the results are better in terms of image quality.
The same texts say that the deleterious effects of coma can be similarly (but not so dramatically) compensated for by an adjustment in the tilt of the system, but that does not seem to be an option that can be explorer with Aberrator. The texts also say that the effects of astigmatism can be slightly reduced by an adjustment of focus, but it appears that Aberrator is already evaluating the effects of the aberration it lists under that name close to the optimal focus point for it -- introducing even a small amount of focus error enlarges the computed point spread function by stretching it either horizontally or vertically.
Note that the test image used here is of rather high contrast (as are the lights and shadows on the Moon). Slightly different results are obtained using the much "softer" Jupiter image supplied with the Aberrator V2.53 download. In general the transition from the regime where a decrease of operating wavelength causes an improvement in resolution to the one where no further improvement is seen, occurs when the aberration rating at the current operating wavelength is between about 0.5 and 1.0 waves, with spherical aberration (after correction of focus) being still the most tolerant. Sometimes, near the transition point, Aberrator predicts a specific wavelength that gives a very slightly sharper image than neighboring wavelengths on either side, but such anomalies are not large enough to obscure the general trend.
- In a reflecting system that is well corrected at the current operating wavelength (the 1/4-wave maximum error examples), shifting to a shorter operating wavelength invariably results in an improvement in crater detection threshold.
- When the system error reaches a value of 1-wave peak-to-valley at the current operating wavelength, the angular resolution is likely to be limited by the geometric error, and reducing the diffraction by shifting to a shorter wavelength may or may not result in an improvement in crater detection threshold, depending on the pattern of the aberration. If it is purely spherical aberration a considerable improvement can be expected, if it is astigmatism (or perhaps coma) little or no improvement in resolution is expected.
- In the real world, the preceding results may be vitiated by atmospheric seeing and exposure time considerations. The amplitude and frequency of the seeing errors may increase at a shorter wavelength, and if the shift requires an increase in exposure time, that may also be detrimental to achieving an improved threshold.
- Short of problems with seeing and exposure time, shifting the operating wavelength of a reflecting telescope to the blue (shorter wavelengths) may not (if the geometric aberrations are dominant) improve the crater detection threshold, but it is never expected to make it worse.
- Refracting systems, or systems with refracting elements (such as Barlow lenses) may behave somewhat differently. Because the refractivity of glass is slightly higher in the blue, the intrinsic geometric errors will be very slightly enhanced, but this effect is expected to be small (for the common optical glass BK-7, the increase in refractivity between 780 and 450 nm is just 2.7%, so the basic aberrations, which would be enhanced by this same amount, are not sensibly different). Much more importantly, in a refracting system, rays of different wavelengths are not expected to come to a common focus. This is not a problem if the system is operated monochromatically (as in solar observing), but if a range of wavelengths is used, and the individual wavelengths don't produce images falling within a single depth of focus, the resolution will be degraded. If the correction for commonality of focus is better in the green than the blue, then the loss of a common focus may vitiate the advantages of shifting to the blue that are demonstrated above.
This page has been edited 10 times. The last modification was made by -  JimMosher on Aug 14, 2008 1:46 pm