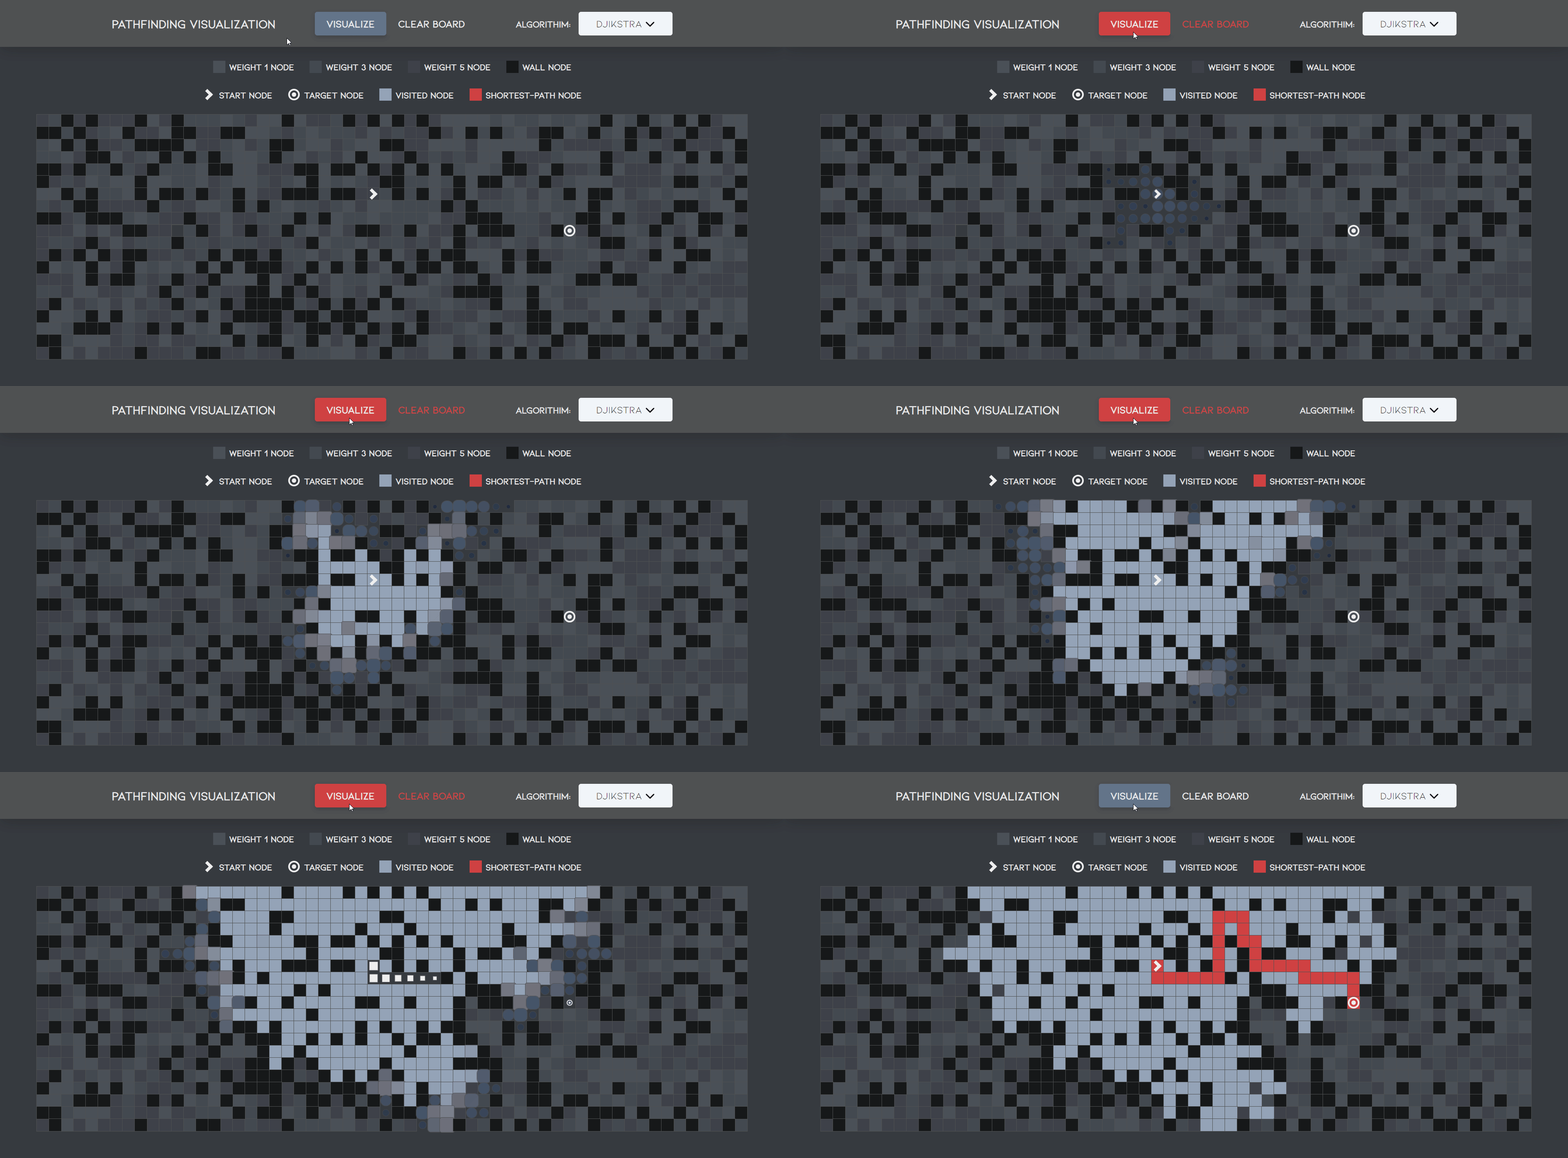
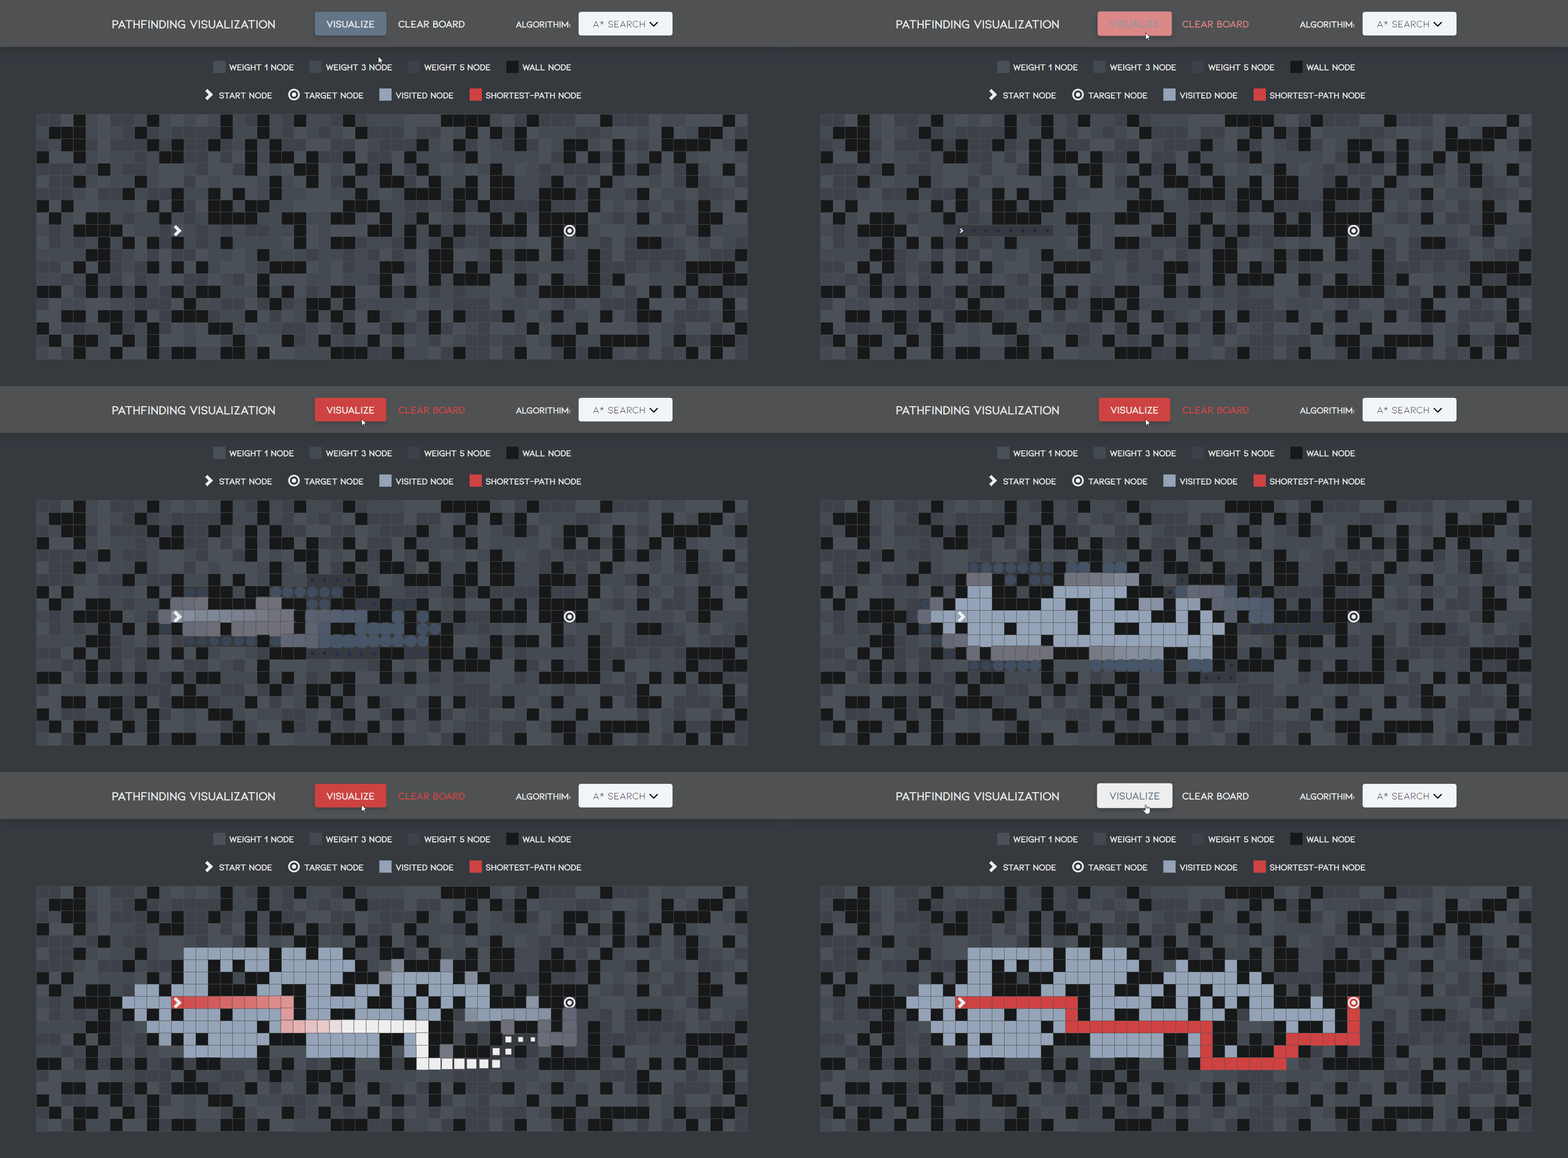
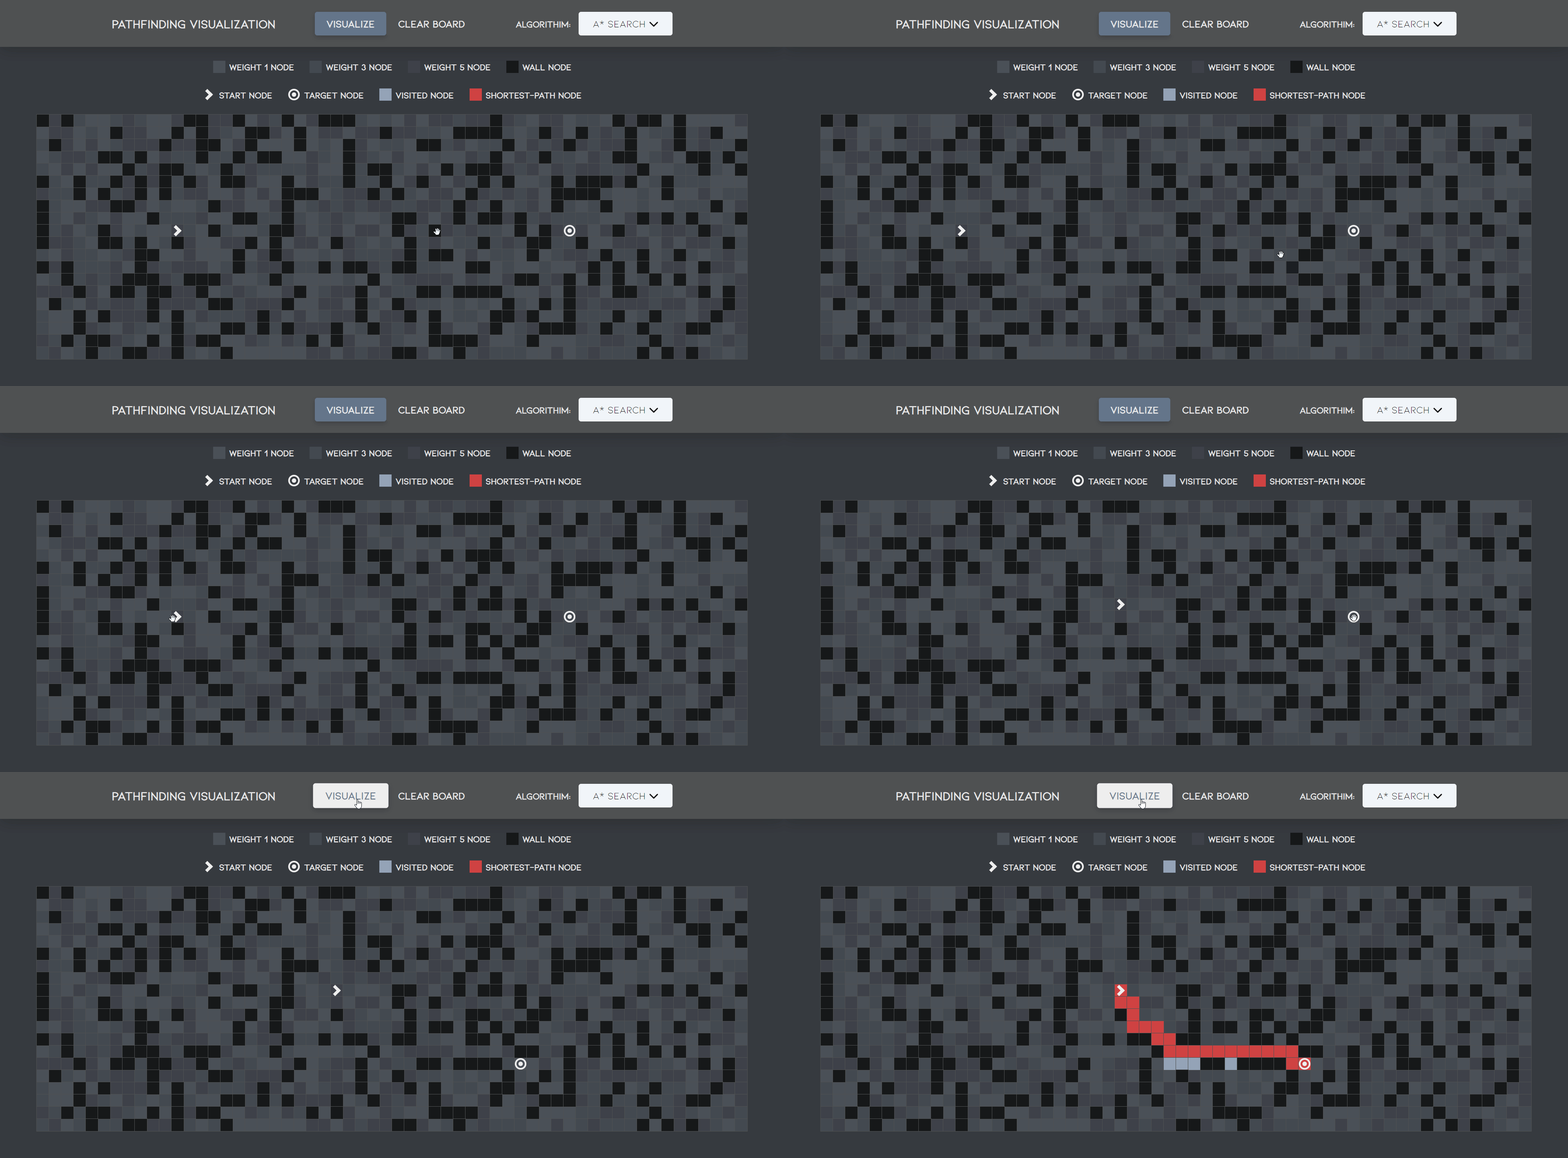
A visualization tool built in Vue for the A* and Dijkstra Algorithms.
Check Out the Demo »
A* and Dijkstra's algorithm are both graph search algorithms that are used to find the shortest path between two nodes in a graph. The main difference between them is the way they calculate the cost of reaching the goal node.
Dijkstra's Algorithm guarantees the shortest possible path to it's target, it does this by beginning it's search from it's starting node and fully exploring every neighboring node until it reaches it's target. This means that it can be slow when searching over large areas due to the fact it will continue searching even if it's going in the opposite direction of it's target.
A* optimizes on Dijkstra's original algorithm by applying heuristics to first search nodes that are in the direction of it's target which can lead to much faster calculation times than Dijkstra's.
Pathfinding algorithms can be quite confusing to wrap your head around as a beginner. I decided to build this app to help myself more deeply understand how the A* Algorithm and Dijkstra's Algorithm find their optimal path and see the results in action.

 You can also drag and drop the start/end locations and toggle walls.

- Install NPM Packages
npm install- Run the Development Server
npm run serve