runtime: GC causes latency spikes #14812
Comments
|
The GC will use as much CPU as is available. If your program is basically On Mon, Mar 14, 2016 at 1:54 AM, Dieter Plaetinck notifications@github.com
|
just a guess, but perhaps the cause is the extra workload induced by the write barrier? (i watched your gophercon talk again today :) Interestingly, when I use top, i haven't been able to ever catch a core running at 100%. But you're right that there's essentially two things going on, which may or may not be related:
Let me know how I can help. |
|
Hi @Dieterbe, could you clarify what the issue is? 15s for 6.5GB is actually pretty good (I get ~5s/GB of CPU time on some benchmarks locally, but this can vary a lot based on heap layout and hardware). If it's that the CPU utilization goes up during GC, please clarify why this is a problem (the GC has to do its work somehow, and FPGA accelerators for GC are still an open area of research :) If it's that response time goes up during GC, could you try the CL in #15022? (And, if you're feeling adventurous, there's also https://go-review.googlesource.com/21036 and https://go-review.googlesource.com/21282) |
|
Hey @aclements!
ok , fair enough for me. i just reported this here because @davecheney mentioned in
of course, this is by itself not a problem.
initially the ticket wasn't about this, but it was brought up and is definitely a problem for us. so from now on we may as well consider this the issue at hand. |
|
@Dieterbe, would it be possible for you to collect a runtime trace (https://godoc.org/runtime/trace) around one of the periods of increased latency? If you do this with current master, the trace file will be entirely self-contained (otherwise, I'll also need the binary to read the trace file). I have a hunch about what could be causing this. GC shrinks the stacks, so if many of your goroutines are constantly growing and shrinking the amount of stack they're using by at least a factor of 4, you would see a spike as many goroutines re-grew their stacks after the shrink. This should be more smeared out on master than with Go 1.6 since f11e4eb made shrinking happen concurrently at the beginning of the GC cycle, but if this is the problem I don't think that would have completely mitigated it. (Unfortunately, the trace doesn't say when stack growth happens, so it wouldn't be a smoking gun, but if many distinct goroutines have high latency right after GC that will be some evidence for this theory.) |
|
Hey @aclements |
|
I read through and #9477 and #10345 and wonder if this issue is another similar case? note that this app is centered around a map (https://github.com/raintank/raintank-metric/blob/master/metric_tank/mdata/aggmetrics.go#L13) that has just over 1M values (and each value in turn has a bunch of pointers to things that have more pointers, and lots of strings involved too). optimizing this is on my todo, but in the meantime i wonder if maybe a GC thread blocks the map leaving other application threads (mutators) unable to interact with the map. and since everything in the app needs this map, it could explain the slow downs? |
|
@Dieterbe, it's possible. Could you try the fix I posted for #10345? (https://golang.org/cl/23540) Note that it's not that the GC thread blocks the map. Mutators are free to read and write the map while GC is scanning it; there's no synchronization on the map itself. The issue is that whatever thread gets picked to scan the buckets array of the map is stuck not being able to do anything else until it's scanned the whole bucket array. If there's other mutator work queued up on that thread, it's blocked during this time. (Sorry I haven't had a chance to dig into the trace you sent.) |
|
I dug into the trace you posted (thanks!) and took another look at your gctrace. This is pretty clearly an over-assist problem. When the GC is running, the expected 25% of the CPU goes to dedicated GC workers, but nearly all of the rest of the CPU time goes to GC assists triggered by allocation. Hence, when GC is running, even though it's technically concurrent, nearly all of the CPU is being soaked up by GC. You can see this really clearly in the trace:
The GC kicks in in the middle. When the GC isn't running, all of the user goroutine executions are really short and the system keeps up. As soon as GC kicks in, two Ps go to dedicated gcBgMarkWorkers (expected) and everything else turns to a checkerboard of 10–20 ms long user goroutine time slices (not expected). Because of this, the run queue lengths climb rapidly (the second row in the group of three at the top), which is almost certainly what's causing the latency spikes. Right after GC finishes there's a period where the user goroutines are running quickly again but they're packed much more densely as it drains the long run queues and returns to normal. I don't yet understand why this is happening. The heap is in steady state, so I would expect it to compute an assist ratio that causes it to finish roughly half way between the trigger and the goal, but it seems to be computing a much higher assist ratio and finishing much earlier. @Dieterbe, could you re-run your application with GODEBUG=gctrace=1,gcpacertrace=1 and grab stderr? It would be awesome if you can run with master, since there's more gcpacertrace output than there was in 1.6, but even the 1.6 output would be helpful. |

|
hey @aclements i recompiled latest master go, then compiled my app with it, and ran with that GODEBUG variable. if it helps, here's a dashboard of the entire run: the "golang GC" graph 2nd row middle and "request handle duration (all steps)" 3rd row on right will probably be most helpful. |
|
@Dieterbe, is there a way I can run the load test with fake traffic myself? I built metric_tank (I had to switch github.com/grafana/grafana/pkg/log to origin/metrics_reporting, but otherwise go get just worked), but I don't know how to run it. |
i'm not sure what's metrics_reporting, but the log problem is caused due to grafana recently changing up its logging mechanism, you can just checkout the last commit before that (grafana/grafana@22cda19) and metric-tank will build fine against it. as for running it, MT (metric tank) relies on cassandra, elasticsearch and nsqd (from the nsq.io project) at runtime. the easiest (hopefully) way to get it all up and running is by using https://github.com/raintank/raintank-docker, so you can follow that readme, with a few changes:
these tools set up the "contextual circumstances": fake_metrics generates an input stream, inspect-es piped to vegeta triggers a consistent http request load. you might hit some snags in the process of getting this all up and running though, and i would hate to have you lose much time with this. but i could hop on a call or whatever to help out. thanks. |
|
I think I got it up and running (with many tweaks), but now I'm a little stuck.
|
|
hey @aclements sorry you had to go through that. what i personally do is compile metric-tank manually on the host, so that the binary is $GOPATH/src/github.com/raintank/raintank-metric/metric_tank/metric_tank, and then make raintank-docker/raintank_code/raintank-metric a symlink to $GOPATH/src/github.com/raintank/raintank-metric/metric_tank/ . you can see in fig.yaml, the metricTank entry, that ./raintank_code/raintank-metric from the host gets mapped to /go/src/github.com/raintank/raintank-metric within the container using a docker directory mapping. in other words, the directory in the container is synchronized with the host, so whatever you compile on the host will be available in the container.
A) using vegeta. in the vegeta attack command you already have, probably change the duration from 120m to about 5m or so, to make the benchmark shorter. then it should be as simple as B) if grafana is running properly in the container (the easiest to verify is to attach to the screen session and go to the grafana tab. in fact you may want to check out all tabs just to verify nothing's obviously broken. usually the last tab i switch to is the benchmark one. there you'll have the console where vegeta is executing and where you can run more vegeta commands). but anyway if grafana's running then you can go to http://localhost:3000, log in as admin:admin and load the "metric tank" dashboard. that's the dashboard i've been using to provide the snapshots above. it should show real-time stats coming in (which it loads from graphite, which also runs in a container) |
|
I spent much of this week working on this. I still have ideas on my list, but wanted to post an update. First, I was able to bring up the whole system with a custom runtime and observe the behavior through Grafana and However, I was still able to dig into the execution traces and glean some insight. I fixed some problems with high goroutine churn potentially losing track of assist credit, and with the way we build up spare assist credit causing long assists when the assist ratio is high (which it is in Metric Tank). I also did several more experimental changes, which did get rid of the bad checkerboard pattern in the execution trace and break it up into a much more finely interleaved workload. This is certainly what we want to see in the trace, but it didn't seem to move the overall stats. I have a few more ideas on why that may be, but I'll be out next week, so it may be a little bit before I can try them. I'm going to mail a bunch of my experimental commits, which should get linked here shortly. @Dieterbe, if you have time, it would be good try running with these, though I'm not sure you'll see much difference. I did notice one thing you may be able to change on the application side to mitigate some of the problem. I think Metric Tank is allocating very small objects at a very high rate. This is causing the GC scan rate to be much lower than typical, since the memory access pattern is even more random than typical. This is stretching out the GC assists and interacting poorly with some of the tuning that assumes a more typical scan rate. It would be worth doing a heap profile with |
yeah it's not trivial to consistently trigger clear symptoms (large spikes). But it seems more load always seems to help.
I run https://github.com/meltwater/docker-cleanup/blob/master/docker-cleanup-volumes.sh periodically in between runs of the stack, this frees up space.
Oh boy. I already went through weeks of optimizing memory allocations and what's left now is a bit harder. IIRC the remaining inefficiencies are about allocating a whole bunch of strings (several for each incoming metric). optimizing that (splitting up in the incoming stream in separate data and metadata streams, string interning, using enums, etc) is on the agenda but will require a broader architectural overhaul
Enjoy your time off! |
Mounting a directory on another partition into the container might help with this. |
|
Postponing to 1.8. |
|
CL https://golang.org/cl/25155 mentions this issue. |
I know this goes way beyond the scope of the Go runtime, but as it's arguably a common configuration I think it warrants mentioning: such a behavior (CPU spike during GC) is not desirable when using CFS bandwidth control I am not saying that we need to necessarily do something about this in Go, just that this may not be the most desirable behavior in a pretty common configuration (running a go program in a linux container with cpu limits), and therefore stretching a bit the definition of "working as intended" if the intention is having consistent sub-ms stop-the-world pauses. |
|
In my experience keeping a large map (10M entries) seriously impacts the system latency. Under heavy loads the typical response time is under 100 microseconds. When GC kicks in, the system stops responding altogether for 3-4 seconds. It happens every ~5 minutes. The system has 4 cores. In the gctrace I see that GC frees ~8GB of memory and it takes most of 4s. In this scenario GC consumes all cores. The flow is: default HTTP server gets a short HTTP GET (under 200 bytes), handler looks in the map (syncmap), generates a short response (under 200 bytes). The map gets a new entry or two every few hours. In one approach GC could avoid scanning objects which appear to live long time. Low level malloc/free API in the unsafe package could help me as well. I switched to BigCache which solved the problem. |
|
If you could turn that large map problem into some sort of a test or benchmark, that would be really useful. There's a short list of few-millisecond hiccup causes, but I don't know of any related to maps. |
|
@dr2chase This is not quite a "benchmark" you probably have in mind, but it demonstrates the latency problem https://github.com/larytet-go/map-benchmark The issue is in no way a new one. I assume that the behavior is by design. If GC sees that the system remains busy it will stay put (GC "marker" lags allocations) until the amount of allocated memory crosses a threshold (GCPercent?). The threshold forces the GC's hand. GC will consume all available cores, release the allocated memory, return to hibernation (background). I think that I understand some of the trade offs. GC's main goal is to let the system serve occasional short spikes with minimal latency impact (?). Devops is expected to add nodes until the latency distribution hits the target. I do have a strong opinion about this. The GC is excellent when the machine has CPUs to spare and/or the service waits for I/O a lot. I personally prefer predictable latency with well defined and reasonable worst case. I wonder why there is no a separate list for long living objects, const pointers, access to runtime/unsafe malloc/free, a buddy allocator in the standard library, more GC tuning options, GC feedback and so on. Is it possible to avoid scanning 10M pointers in a map each and every time GC wakes up? Should I use rate limiter in all services? I agree that my opinion is not a very educated one. In the trace on a 4 core system I see Links |
|
Sorry for the huge delay in replying, the short answer to your problem is "don't call memstat that often and don't put the call someplace you would mind waiting for an answer". There was an old problem with memstat blocking till the GC finished; we though we had fixed it, but apparently you have found a new problem with memstat blocking. When I remove the calls to memstat from your test program, all is well. Even when we fix this new bug, frequent calls to memstat are not a great idea, because it actually stops the world. Not for long, but everything. It has overheads. |
|
We have a software in production that has a similar behavior. Memory models is composed of a relatively low number of btrees (10) (IIRC https://github.com/emirpasic/gods#redblacktree) that represent partitions of a large dataset (loaded at startup) of key/value pairs, where the value component is a Go structure and the key is a string Once loaded, the dataset is 95% read and 5% updated From traces it is clearly evident that large delays are caused by GC sweeping and starving mutators (more frequent) or GC STW phase (rare - please see this example)
|

|
Which version of Go? There's several bugs that cause few-millisecond pauses for one or more threads, some are planned for 1.15, one -- failure to preempt call-free long-running loops -- got fixed in 1.14, so if you test with tip and the latency gets better, that was your problem. We also fixed one of the others in 1.14, but it's limited to just a few milliseconds. See #27732 for a discussion of those bugs, and traces showing what they look like -- it would be nice to know if what's causing your problems is new or known. A quick summary of the known bugs (from 27732):
The workaround for bug 1 will also address bug 2 -- if there's no oversized frames to mark, the size of the accounting error is small, also. Bug 3 is rare, usually only occurs during program startup or if your code is very very good at not generating garbage; if the heap is completely live, scanning for a free slot can run very long. The workaround is somewhat nutty -- add a counter to the allocator for the problem, and every 64 allocations ( If you try these workarounds and one of them works, that's really useful information about which bugs is the bigger problem and needs attention first. It's also helpful to exclude startup from delay stats for long-running servers; those are a separate category of bug, and (our opinion) not nearly as important as steady-state glitches. They do matter; minor changes in startup heap growth heuristics have a noticeable effect on build speed, so we care, just not as much. |
|
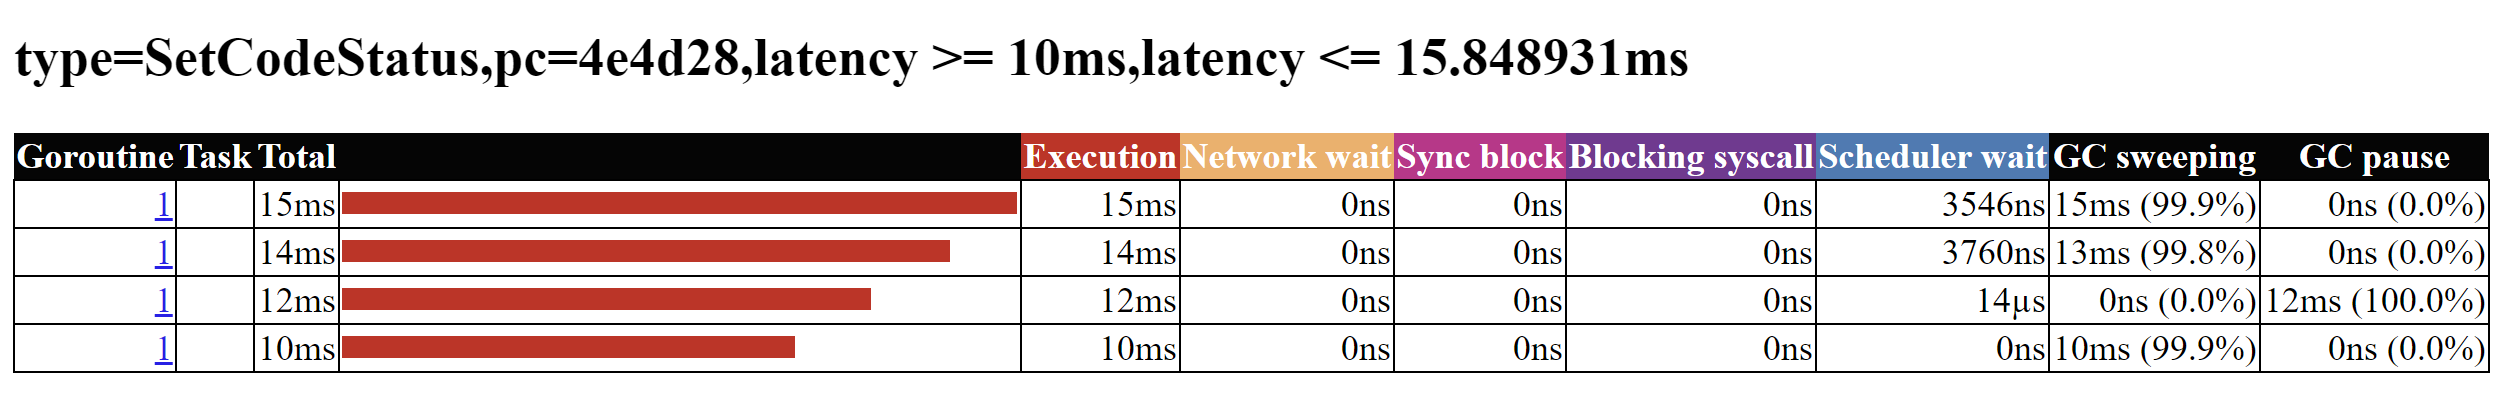
Thanks for the detailed follow-up I have a reduced/modified version of the sample program that I can publish if needed. Behavior is the same with 1.13 and tip (go version devel +563287ae06 Mon Jan 13 23:35:18 2020 +0000 windows/amd64) Based on your explanation it look like we are in scenario (3) I expect that the real live heap is about 95% of the total heap This is a sample fragment of the output of the trace tool: I will provide source code and other details as soon as possible |

|
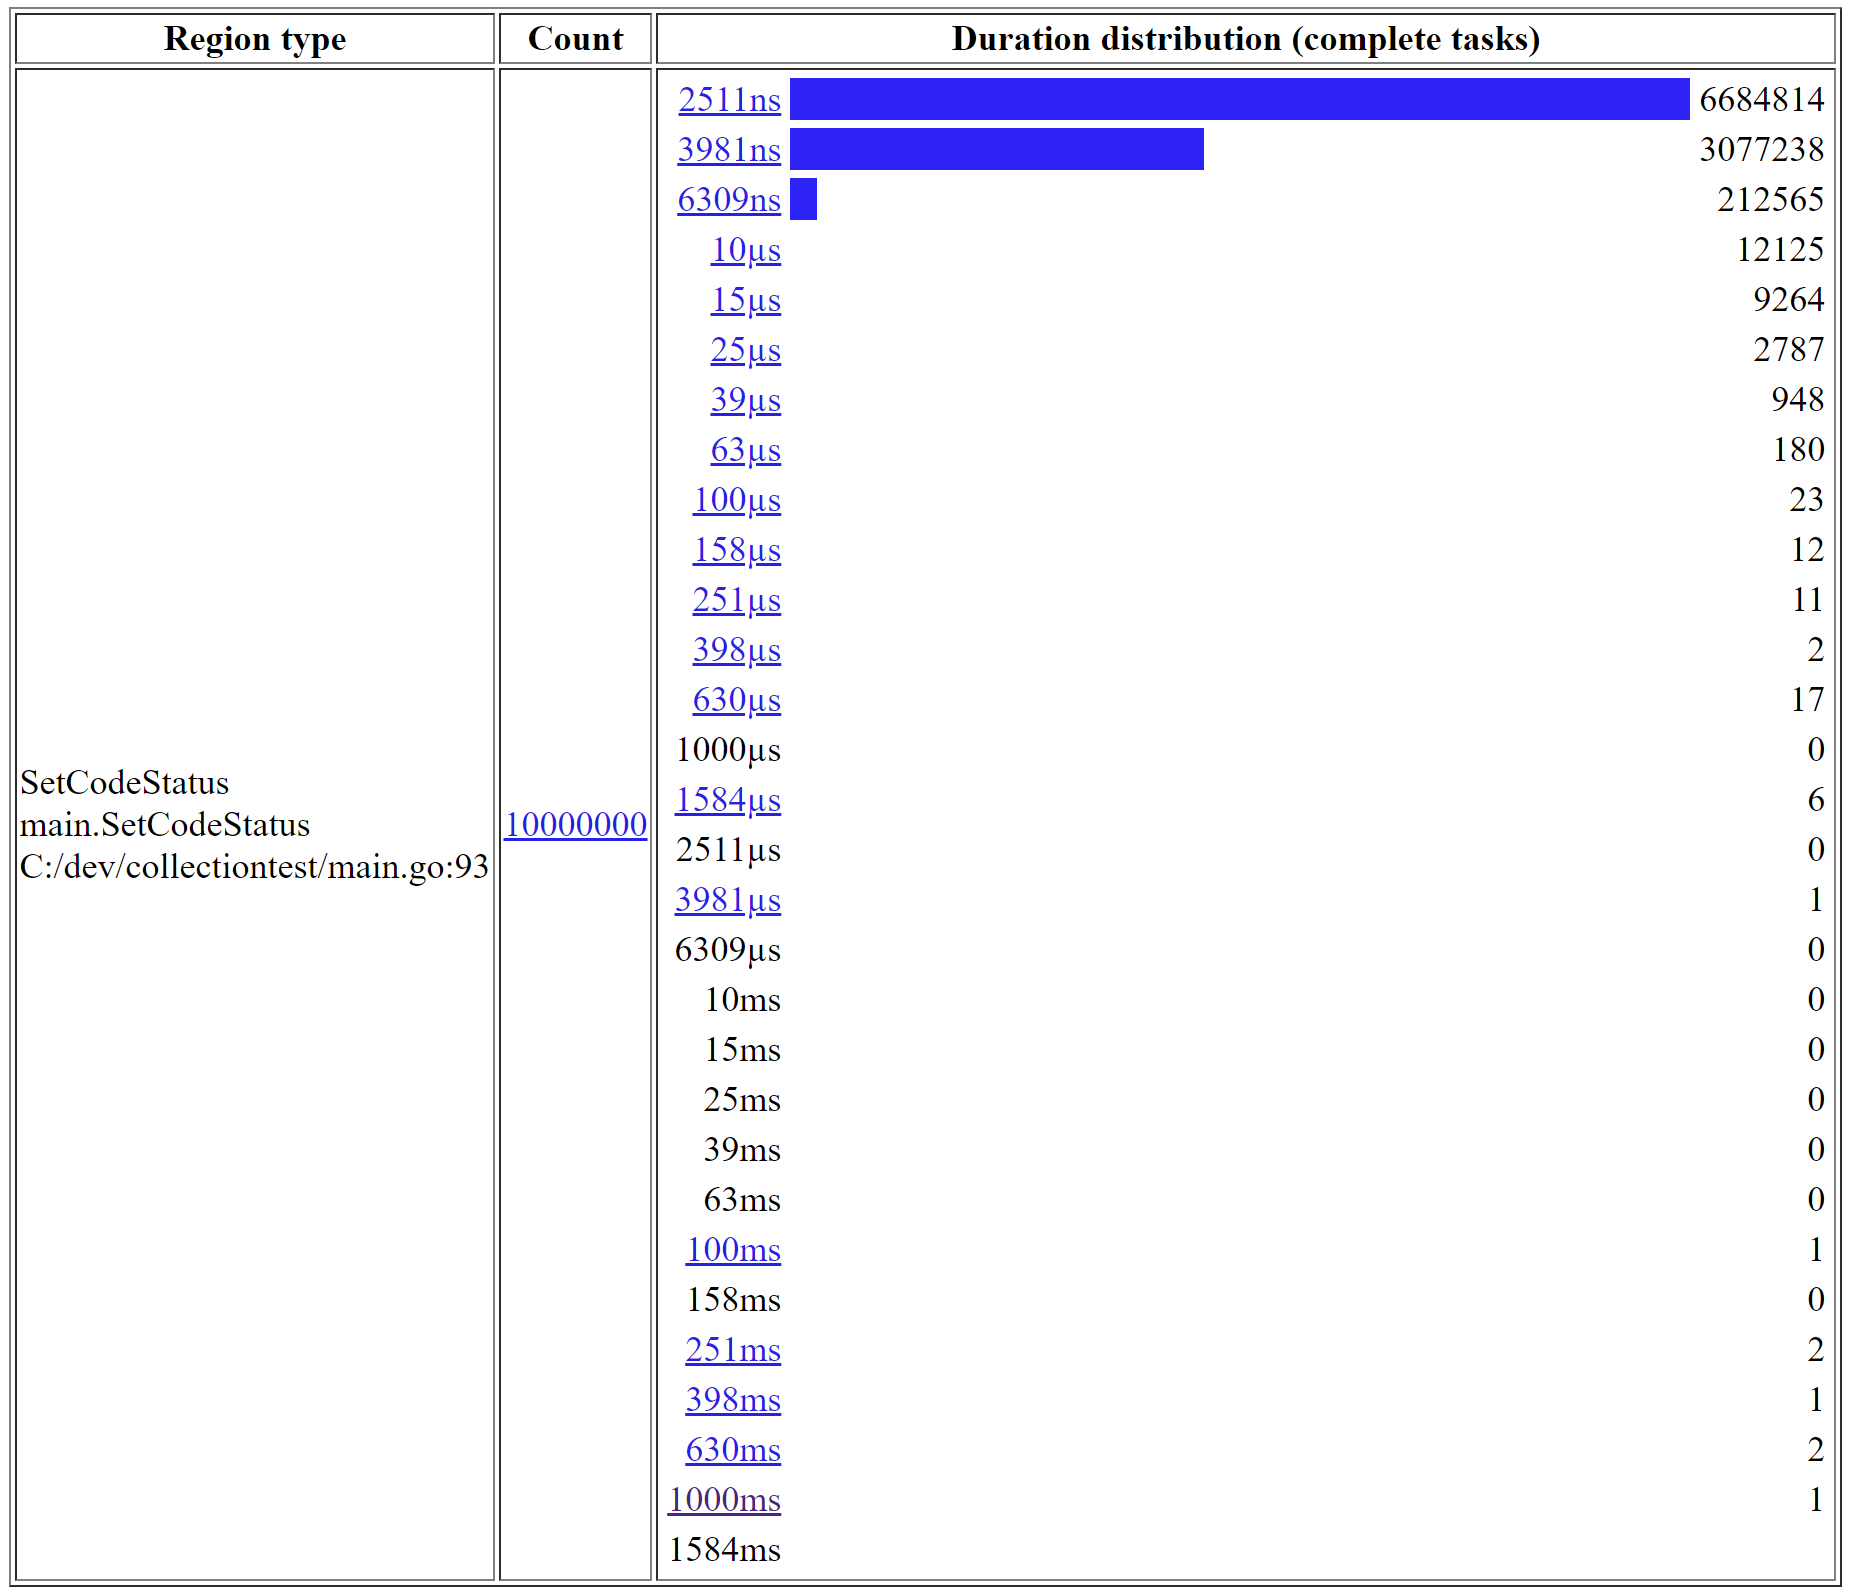
please check repro code here: https://github.com/genez/collectiontest in production code we are not using stdlib maps because they do not shrink and cause OOM panics, we use a custom data structure (an rb+ tree where we serialize the items as a byte slice) on my test bench (Intel i9 16 core, 32 GB of RAM) I can repro >10ms latency it looks like the platform (win, linux) does not matter
|
|
Short answer it is definitely sweeping, and the patch for sweep delays works nicely. You can see these in the MMU graph, here's a particularly terrible one (some look great, this one is awful even with an experimental "fix"). By turning the mark-assist toggle on and off you can see where most of the problem comes from:
|


|
Thank you for this insight! I'm sorry but I am not that confident in runtime internals |
|
"Turning mark assist off" refers to the theft-of-time toggles for the graph; if you don't count mark-assist "theft" of mutator time, the worst-case delay is below 10ms, and the longest window in which only 50% of the cpu is available is about 25-30ms. Turning mark assist "on" (in the accounting), the 50% point is pushed out into seconds. The chart shows "minimum mutator utilization" (MMU) and is available from "go tool trace". The time on the bottom (x-axis) is the size of a window that is slid across the trace, and the fraction (y-axis) is the minimum for all windows (of that size) fraction of time in which the mutator wanted to run but could not. The toggle buttons ("Include") allow you to specify things that are not mutation -- if it's one of those, then the mutator is "not running". "View" allows you to specify either the entire system or worst-case per-goroutine ("system" runs the window across the threads in a stack, takes the fraction for the entire stack, "Per-goroutine" is instead thread-by-thread). By default the graph shows worst case, and toggling "Percentile" is supposed to get you more nuanced numbers, but I think there is some sort of a bug because I'm not seeing that no matter how hard I fiddle. One thing to be careful of is that this is a distillation of your app's memory allocation, and it is quite possible that it sees mark assist problems that your app will not. Spending a lot of time in mark assist happens when the mutator (your app) is allocating quickly during GC -- when that happens a tax is applied to allocations to prevent the GC from falling too far behind. If your app does more work that is not allocation -- or even if it does a lot more allocations but they are often smaller than in this benchmark -- then you won't see the mark assist problem. Spending a lot of time in sweep (your original problem) is a property of a heap that is very well-filled; it's large, and it's 100% live objects. Right after GC completes, a "background sweeper" thread starts to figure out where free space is, but if the mutator allocates before that thread has processed very much memory, then the mutator has to go looking (sweeping) instead. When a lot of the heap is 100% filled, it can look for a while. The patch for that simply says "after you've looked at 100 spans with no luck, give up and allocate a new span". So, if you're up for patching a Go release, you might try Thanks very much for this benchmark. This gives us a nice reproducible case (taken from a real-world app) of sweep being a problem, which will probably get that fix into 1.15, and it provides a nice motivating case for improving mark assist. |
|
I just repeated the test on a real production-grade linux machine with the following Go versions:
It looks like there's a nice improvement I did try to patch the tip sources, but I get compilation errors: |


At a high level, the runtime garbage collector can impact user goroutine
latency in two ways. The first is that it pauses all goroutines during
its stop-the-world sweep termination and mark termination phases. The
second is that it backpressures memory allocations by instructing user
goroutines to assist with scanning and marking in response to a high
allocation rate.

There is plenty of observability into the first of these sources of
user-visible latency. There is significantly less observability into the
second. As a result, it is often more difficult to diagnose latency
problems due to over-assist (e.g. golang#14812, golang#27732, golang#40225). To this
point, the ways to determine that GC assist was a problem were to use
execution tracing or to use GODEBUG=gctrace=1 tracing, neither of which
is easy to access programmatically in a running system. CPU profiles
also give some insight, but are rarely as instructive as one might
expect because heavy GC assist time is scattered across a profile.
Notice even in https://tip.golang.org/doc/gc-guide, the guidance on
recognizing and remedying performance problems due to GC assist is
sparse.

This commit adds a counter to the MemStats and GCStats structs called
AssistTotalNs, which tracks the cumulative nanoseconds in GC assist
since the program started. This provides a new form of observability
into GC assist delays, and one that can be manipulated programmatically.

There's more work to be done in this area. This feels like a reasonable
first step.
|
Change https://go.dev/cl/431877 mentions this issue: |
|
Go 1.18 introduced a new GC pacer (that reduces the amount of assists) and 1.19 introduced
|
|
I have seen others succeed in speeding up their applications by attempting to reduce the number of allocations made. If Go accommodated this conceptual way of working, it would be easier than optimizing the compiler further. Off the bat is that it would be ideal for supporting functions taking multiple values from return functions to reduce the need to allocate for an error. |
|
Timed out in state WaitingForInfo. Closing. (I am just a bot, though. Please speak up if this is a mistake or you have the requested information.) |
Hello,
while running the program at https://github.com/raintank/raintank-metric/tree/master/metric_tank
I'm seeing mark-and-scan times of
15s cpu time, 20002500 ms clock time. (8 core system) for a heap of about 6.5GB(STW pauses are fine and ~1ms)
I used https://circleci.com/gh/raintank/raintank-metric/507 to obtain the data below.
I know the app is currently not optimized for GC workload: while i've gotten allocations down in various parts of the program there are currently probably about a million or more live pointers referencing pieces of data. I was going to work on optimizing this when Dave Cheney suggested there's a problem with the runtime and I should file a bug (https://groups.google.com/forum/#!topic/golang-nuts/Q0rXKYjy1cg)
Here's the log with gctrace and schedtrace enabled: https://gist.githubusercontent.com/Dieterbe/18453451c5af0cdececa/raw/9c4f2abd85bb7a815c6cda5c1828334d3d29817d/log.txt
at http://dieter.plaetinck.be/files/go/mt3-qa-gc-vs-no-gc.zip you'll find a zip containing this log, the binary, a cpu profile taken during gc run 1482, and a cpu and heap profile in between run 1482 and 1483
I also have these two dashboards that seem useful. (they both end just after the spike induced by GC run 1482)
https://snapshot.raintank.io/dashboard/snapshot/MtLqvc4F6015zbs4iMQSPzfizvG7OQjC
shows memory usage, GC runs and STW pause times. it also shows that incoming load (requests) of the app is constant so this conveys to me that any extra load is caused by GC, not by changing workload
https://snapshot.raintank.io/dashboard/snapshot/c2zwTZCF7BmfyzEuGF6cHN9GX9aM1V99
this shows the system stats. note the cpu spikes corresponding to the GC workload.
let me know if there's anything else I can provide,
thanks,
Dieter.
The text was updated successfully, but these errors were encountered: