runtime: 10ms-26ms latency from GC in go1.14rc1, possibly due to 'GC (idle)' work #37116
Comments
 cagedmantis
added
the
NeedsInvestigation
cagedmantis
added
the
NeedsInvestigation

|
/cc @aclements @rsc @randall77 |

|
I think this is working as expected. At the heart of Since a real server would need to lock the map, sharding it would be a good idea, which would also reduce the latency impact of a mark. (cc @rsc, since I think @cagedmantis made a typo.) |

|
The following may be relevant. From https://golang.org/pkg/runtime/
func GC <https://golang.org/src/runtime/mgc.go?s=37860:37869#L1026>
func GC()
GC runs a garbage collection and blocks the caller until the garbage
collection is complete. It may also block the entire program.
In the section about the trace line:
If the line ends with "(forced)", this GC was forced by a runtime.GC() call.
The trace contains
gc 15 @432.576s 4%: 0.073+17356+0.021 ms clock, 0.29+0.23/17355/34654+0.084
ms cpu, 8697->8714->8463 MB, 16927 MB goal, 4 P GC forced
at the point indicated as the cause of the issue and the second screenshot
looks like a call to runtime.GC is made and the mutator thread is stopped
and the GC is run.
I would look into whether runtime.GC is called and if the call is in the
dynamic scope of code being timed. If so remove the runtime.GC call and see
if that makes any difference.
And kudos for helping out testing the new release candidate.
…On Sun, Feb 9, 2020 at 2:03 PM Heschi Kreinick ***@***.***> wrote:
I think this is working as expected. At the heart of
github.com/golang/groupcache/lru is a single large map
<https://github.com/golang/groupcache/blob/8c9f03a8e57eb486e42badaed3fb287da51807ba/lru/lru.go#L33>.
AFAIK the map has to be marked all in one go, which will take a long time.
In the execution trace above you can see a MARK ASSIST segment below G21.
If you click on that I think you'll find that it spent all of its time
marking a single object, presumably the map. Austin and others will know
better, of course.
Since a real server would need to lock the map, sharding it would be a
good idea, which would also reduce the latency impact of a mark.
(cc @rsc <https://github.com/rsc>, since I think @cagedmantis
<https://github.com/cagedmantis> made a typo.)
—
You are receiving this because you are subscribed to this thread.
Reply to this email directly, view it on GitHub
<#37116?email_source=notifications&email_token=AAHNNHYCOXRMJYP62MDEGO3RCBHPVA5CNFSM4KRSQU32YY3PNVWWK3TUL52HS4DFVREXG43VMVBW63LNMVXHJKTDN5WW2ZLOORPWSZGOELGU7RA#issuecomment-583880644>,
or unsubscribe
<https://github.com/notifications/unsubscribe-auth/AAHNNH2BVNJP6PVXBKZJ3ZTRCBHPVANCNFSM4KRSQU3Q>
.
|

|
On Sun, Feb 9, 2020 at 2:38 PM Richard L. Hudson <notifications@github.com>
wrote:
The following may be relevant. From https://golang.org/pkg/runtime/
func GC <https://golang.org/src/runtime/mgc.go?s=37860:37869#L1026>
func GC()
GC runs a garbage collection and blocks the caller until the garbage
collection is complete. It may also block the entire program.
In the section about the trace line:
If the line ends with "(forced)", this GC was forced by a runtime.GC()
call.
The trace contains
gc 15 @432.576s 4%: 0.073+17356+0.021 ms clock, 0.29+0.23/17355/34654+0.084
ms cpu, 8697->8714->8463 MB, 16927 MB goal, 4 P GC forced
at the point indicated as the cause of the issue and the second screenshot
looks like a call to runtime.GC is made and the mutator thread is stopped
and the GC is run.
I would look into whether runtime.GC is called and if the call is in the
dynamic scope of code being timed. If so remove the runtime.GC call and see
if that makes any difference.
And kudos for helping out testing the new release candidate.
On Sun, Feb 9, 2020 at 2:03 PM Heschi Kreinick ***@***.***>
wrote:
> I think this is working as expected. At the heart of
> github.com/golang/groupcache/lru is a single large map
> <
https://github.com/golang/groupcache/blob/8c9f03a8e57eb486e42badaed3fb287da51807ba/lru/lru.go#L33
>.
> AFAIK the map has to be marked all in one go, which will take a long
time.
This is no longer true. We now break large objects, like maps, into
bounded-size chunks.
https://go-review.googlesource.com/c/go/+/23540
That was submitted mid 2016, so Go1.8?
… > In the execution trace above you can see a MARK ASSIST segment below G21.
> If you click on that I think you'll find that it spent all of its time
> marking a single object, presumably the map. Austin and others will know
> better, of course.
>
> Since a real server would need to lock the map, sharding it would be a
> good idea, which would also reduce the latency impact of a mark.
>
> (cc @rsc <https://github.com/rsc>, since I think @cagedmantis
> <https://github.com/cagedmantis> made a typo.)
>
> —
> You are receiving this because you are subscribed to this thread.
> Reply to this email directly, view it on GitHub
> <
#37116?email_source=notifications&email_token=AAHNNHYCOXRMJYP62MDEGO3RCBHPVA5CNFSM4KRSQU32YY3PNVWWK3TUL52HS4DFVREXG43VMVBW63LNMVXHJKTDN5WW2ZLOORPWSZGOELGU7RA#issuecomment-583880644
>,
> or unsubscribe
> <
https://github.com/notifications/unsubscribe-auth/AAHNNH2BVNJP6PVXBKZJ3ZTRCBHPVANCNFSM4KRSQU3Q
>
> .
>
—
You are receiving this because you were mentioned.
Reply to this email directly, view it on GitHub
<#37116?email_source=notifications&email_token=ABUSAIHQ2VOL4AOHQ3P236LRCCAUTA5CNFSM4KRSQU32YY3PNVWWK3TUL52HS4DFVREXG43VMVBW63LNMVXHJKTDN5WW2ZLOORPWSZGOELG2KAQ#issuecomment-583902466>,
or unsubscribe
<https://github.com/notifications/unsubscribe-auth/ABUSAIAKOYXJ4SA7QAJ23VDRCCAUTANCNFSM4KRSQU3Q>
.
|
|
Thanks @heschik |

|
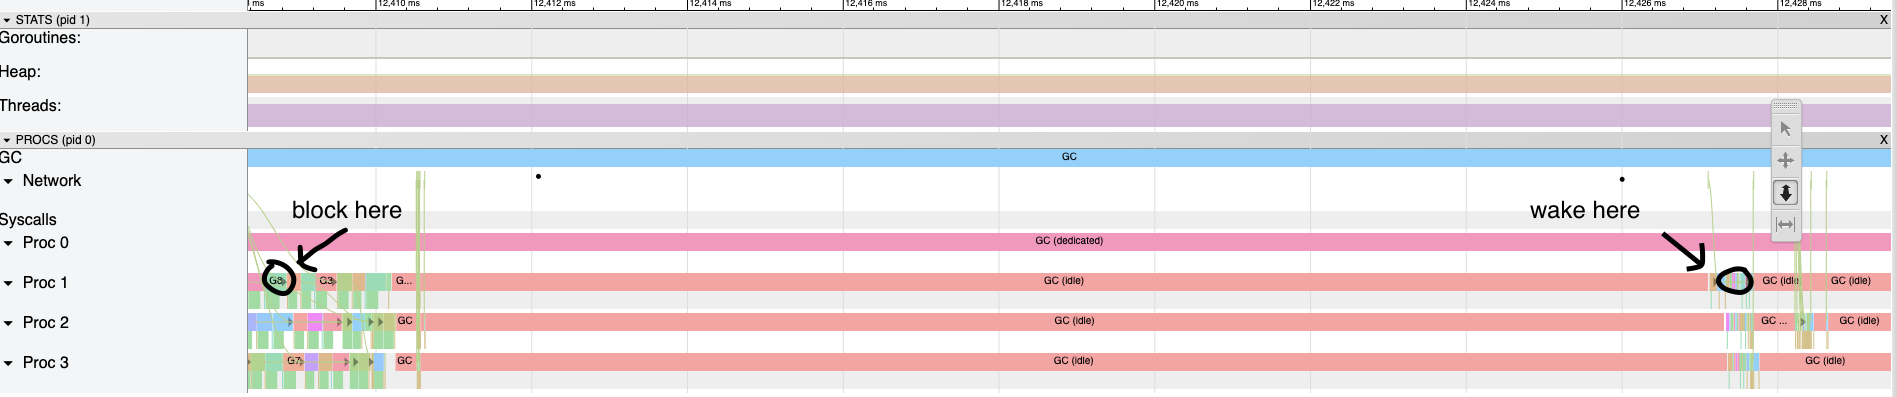
Thanks for trying to put something together to recreate this behavior, especially from the little scraps of information we have. :) Based on the execution traces, I think you're probably right that the idle GC worker is the root of the problem here. The idle worker currently runs until a scheduler preemption, which happens only every 10 to 20ms. The trace shows a fifth goroutine that appears to enter the run queue a moment after the idle worker kicks in, which is presumably the user goroutine. I agree with @randall77 that this is not likely to be related to the large map, since we do break up large objects when marking. In general long linked lists are not very GC-friendly, since it has no choice but to walk the list sequentially. That will inherently serialize that part of marking (assuming it's the only work left), though I don't understand the quoted comment about this happening "with a global lock". I don't think there's been anything like a global lock here since we switched to a concurrent GC in Go 1.5. |


|
The Discord blog post described above had said they saw GC-related latency problems with Go 1.9.2 (and also later said elsewhere they had tested but seemingly not deployed Go 1.10), so part of the intent here was to see if the pauses they reported could be reproduced in Go 1.9.2. Here are some results from running that benchmark above in a loop overnight, with ten 15-minute runs first on 1.9.2 and then on 1.14rc1. Comparing 1.9.2 to 1.14rc1
Each line here in these two tables shows the counts of delays in different ranges for one 15-minute run: Go 1.9.2 counts of delaysGo 1.14rc1 counts of delaysI'm putting the raw results here including so that anyone running this benchmark in the future can see some of the current variability from run to run. |
|
Also, the 5 worst lookups seen in 1.9.2 across those ten runs: As I noted above, this is a simplified benchmark, including the lookups are all done sequentially, so that a GC-induced delay of >100ms might be recorded only in one measurement here, whereas in a real system with parallel inbound requests a GC-induced delay of >100ms might impact many requests at once and hence impact multiple response time measurements. |

|
Rolling forward to 1.16. |


|
|

|
Rolling forward to 1.17 since this is certainly too risky to address in 1.16 at this point. Hopefully @mknyszek 's broader investigation into GC scheduling will improve the situation here. |
|
I'm guessing that this isn't done for 1.17. Should we move this to 1.18 or should we move it to Backlog? |

|
Looking over this quickly, I think it'll be helped a bit by #44163. It looks like the scheduler saw the chance to schedule an idle GC worker because the only piece of work hadn't been observed by the queue, and then it proceeded to hog the whole quantum. I think there are other good reasons to remove the idle GC workers, and this is one more reason. I would really like to remove them early in cycle for 1.18. |


|
Change https://go.dev/cl/393394 mentions this issue: |

|
Re-reading the issue, https://go.dev/cl/393394 should solve the issue. Please feel free to reopen if that's not true. |


What version of Go are you using (
go version)?Does this issue reproduce with the latest release?
Yes, go1.14rc1.
What operating system and processor architecture are you using (
go env)?Ubuntu 18.04.2 LTS (stock GCE image). 4 vCPUs, 15 GB.
go envOutputBackground
A recent blog post reported an issue they saw in the >2 year old Go 1.10 when there are "tens of millions" of entries in an LRU, along with CPU spikes and response time spikes every two minutes, with a p95 response time reportedly hitting 50ms-300ms.
The two minute periodicity was explained within the blog by the following, which seems plausible:
A separate recent post from one of the engineers theorized the problem was due to a very long linked list, but I am less sure if this comment is a precise description of the actual root cause:
An engineer from the same team might have also posted this roughly 2.5 years ago in #14812 (comment)
What did you do?
Write a simple GC benchmark intended to emulate a LRU with a separate free list.
It's not 100% clear what their exact data structures were, including whether or not it was just an LRU that linked elements within the LRU to help with expiring the older items, vs. maybe there was an additional free list that was separate from the LRU, vs. something else entirely.
Last night, without too much data, I put together a simple gc benchmark of a LRU cache along with a separate free list.
The benchmark is here:
https://play.golang.org/p/-Vo1hqIAoNz
Here is a sample run with 50M items in a LRU cache (a map + the items within the map also are on a linked list), as well as 1M items on separate free list, and a background allocation rate of about 10k/sec:
What did you expect to see?
Ideally, sub-ms worst-case latency impact of GC.
What did you see instead?
This was fairly quick and dirty, and might not be at all related to the problem reported in the blog, but seemed to observe occasionally higher latency values.
It is important to note that the issue here does not seem to be anywhere near the scale reported in the blog:
Here is an example where a single 26ms worst-case latency was observed when looking up an element in the LRU during a forced GC.
I would guess that 26ms lookup latency is likely related to this 26ms 'GC (idle)' period where the main goroutine did not seem to be on a P:
Another sample run:
I suspect this trace section corresponds to the
at=432.596s lookup=11.794msobserved latency:In both cases, the traces started roughly 100 seconds after the start of the process, so the timestamps between the log message vs. images are offset roughly by 100 seconds.
Related issues
This issue might very well be a duplicate. For example, there is a recent list of 5 known issues in #14812 (comment). That said, if this issue is explained by one of the 5 items there, it is not immediately obvious to me which one, including some of the issues in that list are resolved now, but this happens in go1.14rc1. Also possibly related to #14179, #18155, or others.
The text was updated successfully, but these errors were encountered: