runtime/pprof: Missing labels from goroutines stacks containing systemstack #48577
Description
What version of Go are you using (go version)?
$ go version
go version go1.17.1 darwin/amd64
Does this issue reproduce with the latest release?
Yes.
What operating system and processor architecture are you using (go env)?
go env Output
$ go env
GO111MODULE=""
GOARCH="amd64"
GOBIN=""
GOCACHE="/Users/felix.geisendoerfer/Library/Caches/go-build"
GOENV="/Users/felix.geisendoerfer/Library/Application Support/go/env"
GOEXE=""
GOEXPERIMENT=""
GOFLAGS="-count=1"
GOHOSTARCH="amd64"
GOHOSTOS="darwin"
GOINSECURE=""
GOMODCACHE="/Users/felix.geisendoerfer/go/pkg/mod"
GONOPROXY=""
GONOSUMDB=""
GOOS="darwin"
GOPATH="/Users/felix.geisendoerfer/go"
GOPRIVATE=""
GOPROXY="https://proxy.golang.org,direct"
GOROOT="/usr/local/Cellar/go/1.17.1/libexec"
GOSUMDB="sum.golang.org"
GOTMPDIR=""
GOTOOLDIR="/usr/local/Cellar/go/1.17.1/libexec/pkg/tool/darwin_amd64"
GOVCS=""
GOVERSION="go1.17.1"
GCCGO="gccgo"
AR="ar"
CC="clang"
CXX="clang++"
CGO_ENABLED="1"
GOMOD="/Users/felix.geisendoerfer/go/src/github.com/felixge/dump/cpu-profiler-label-bug/go.mod"
CGO_CFLAGS="-g -O2"
CGO_CPPFLAGS=""
CGO_CXXFLAGS="-g -O2"
CGO_FFLAGS="-g -O2"
CGO_LDFLAGS="-g -O2"
PKG_CONFIG="pkg-config"
GOGCCFLAGS="-fPIC -arch x86_64 -m64 -pthread -fno-caret-diagnostics -Qunused-arguments -fmessage-length=0 -fdebug-prefix-map=/var/folders/mg/xwzs985x35789zk2l14nk8k80000gn/T/go-build2698991037=/tmp/go-build -gno-record-gcc-switches -fno-common"
What did you do?
I created a Go program like cpu-profiler-label-bug.go shown below that uses pprof labels and generates a CPU profile:
package main

import (
	"context"
	"fmt"
	"io"
	"os"
	"runtime"
	"runtime/pprof"
	"time"
)

func main() {
	file, _ := os.Create("./cpu.pprof")
	pprof.StartCPUProfile(file)
	defer pprof.StopCPUProfile()

	ctx := context.Background()
	labels := pprof.Labels("foo", "bar")
	pprof.Do(ctx, labels, func(_ context.Context) {
		for i := 0; i < runtime.GOMAXPROCS(0)*10; i++ {
			go cpuHog()
		}
	})
	time.Sleep(10 * time.Second)
}

func cpuHog() {
	for i := 0; ; i++ {
		fmt.Fprintf(io.Discard, "%d", i)
	}
}
I then executed the program and used pprofutils labelframes to turn cpu.pprof into cpu.label.pprof. The latter modifies each sample in the pprof to add a new root frame that contains the value of my label foo (or N/A if the label is not present). This makes it easier to view the labels than in the graph view of pprof.
go run cpu-profiler-label-bug.go
curl --data-binary @cpu.pprof pprof.to/labelframes?label=foo > cpu.label.pprof
go tool pprof -http=:6060 cpu.label.pprof
What did you expect to see?
main.cpuHog should show up only under the foo=bar frame and not the foo=N/A frame:
What did you see instead?
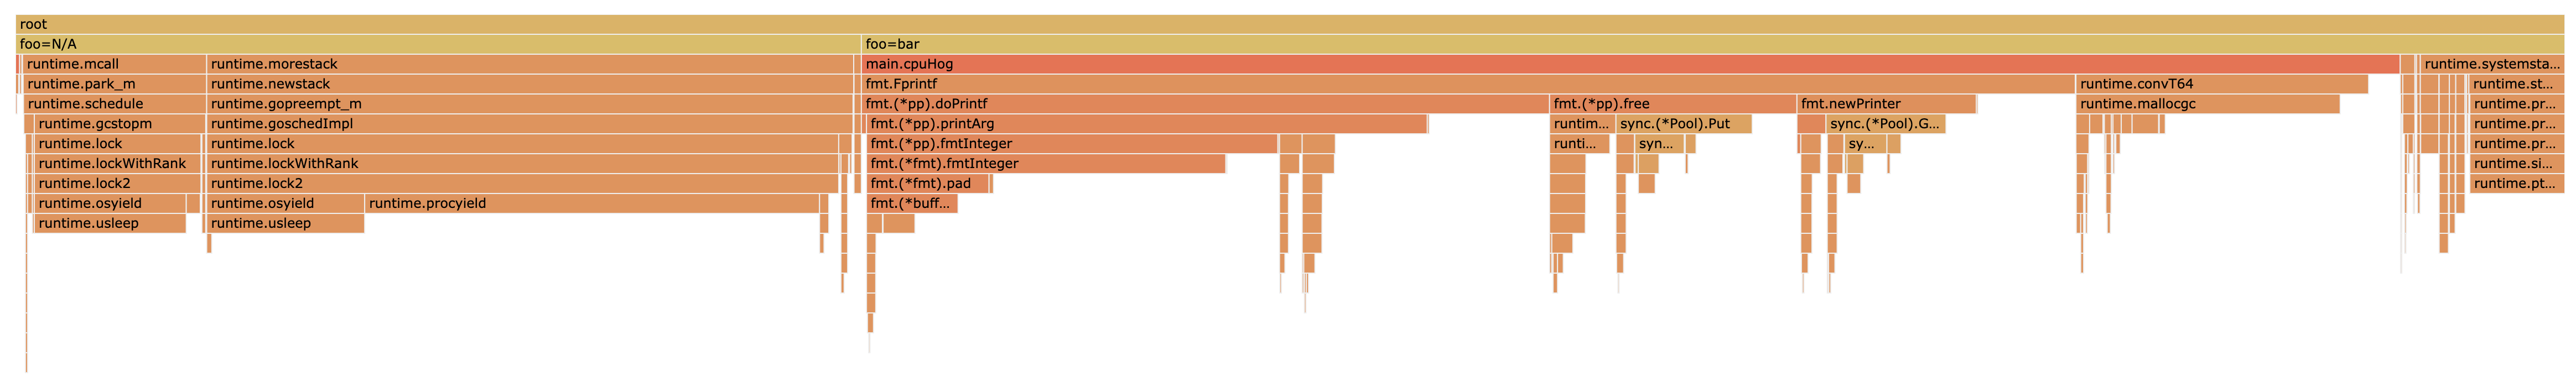
3.95% of all samples containing main.cpuHog show below the foo=N/A frame which means they were missing the foo=bar label.

Zooming into those 3.95% of the flame graph, I noticed that most samples contain a systemstack frame.

See zip file below for code, pprofs and screenshots: cpu-profiler-label-bug.zip
My Analysis
As far as I can tell this problem can be easily fixed via the patch below. In fact that's what I used to create the "What did you expect to see" screenshot above.
diff --git a/src/runtime/proc.go b/src/runtime/proc.go
index a144b36ec8..bebbd7b3b1 100644
--- a/src/runtime/proc.go
+++ b/src/runtime/proc.go
@@ -4773,7 +4773,7 @@ func sigprof(pc, sp, lr uintptr, gp *g, mp *m) {
        }

        if prof.hz != 0 {
-               cpuprof.add(gp, stk[:n])
+               cpuprof.add(gp.m.curg, stk[:n])
        }
        getg().m.mallocing--
 }
The reason this is the right thing to do is because gp.m.curg should always point to the right goroutine, even when the systemstack goroutine is executing. At least that's how traceback.go stitches the stacks together.
Since I suspect this to be the correct fix, I'll be submitting a CL shortly. It's like to fix more situations as well (morestack, newstack, etc.)