A repository to hold code for plotting functions that make creating vizzes using ggplot2 easy
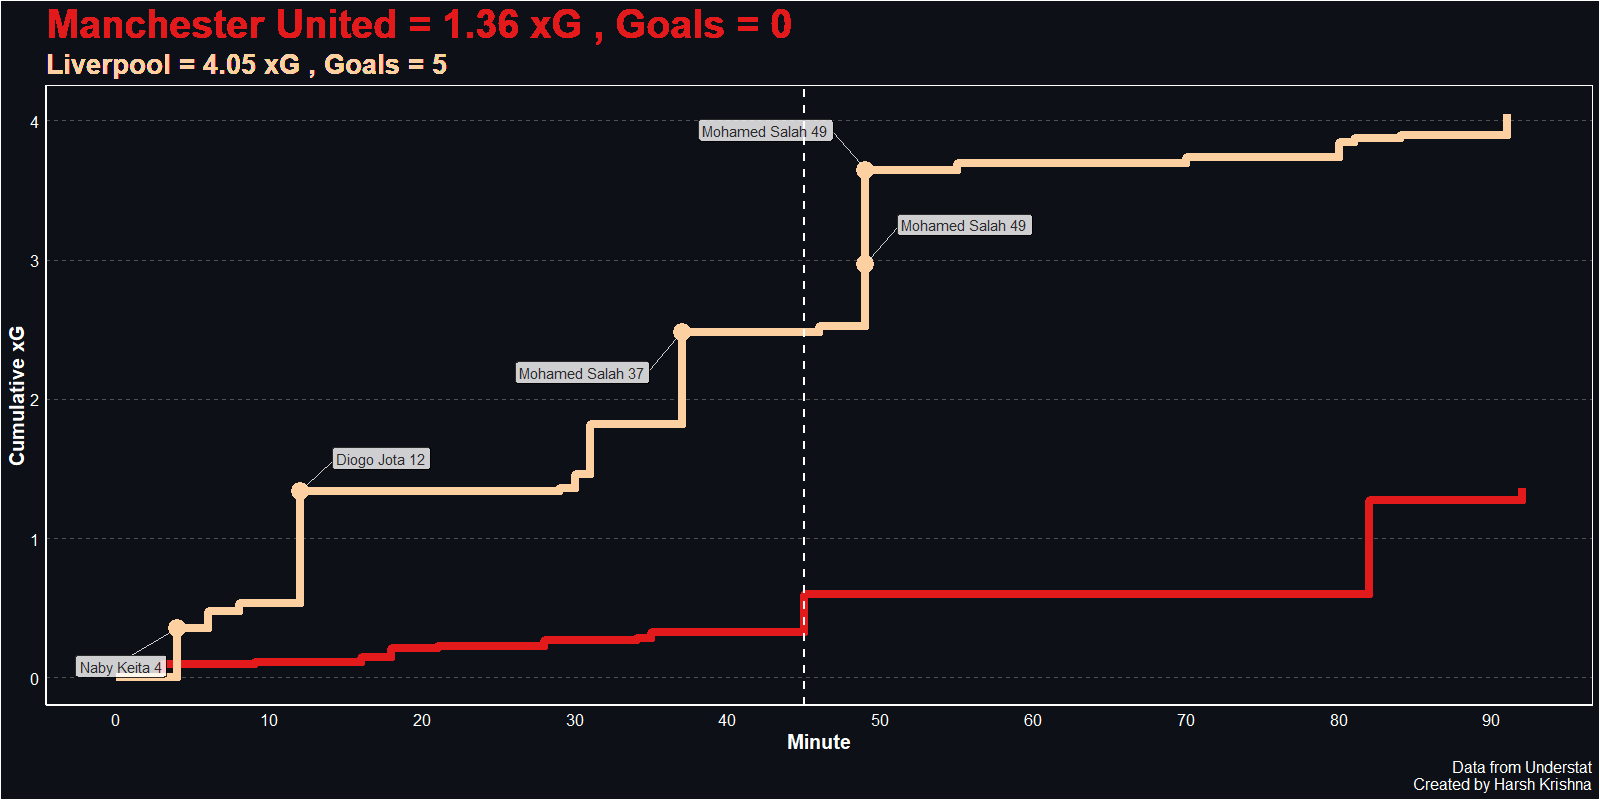
Create an xG race chart using data from Understat. Code to create function
To Create, extract the data, run the function, and run the following line (setting specific parameters) for the final viz.
plot_xgrace(data = data, team_home = "Manchester United", team_away = "Liverpool",
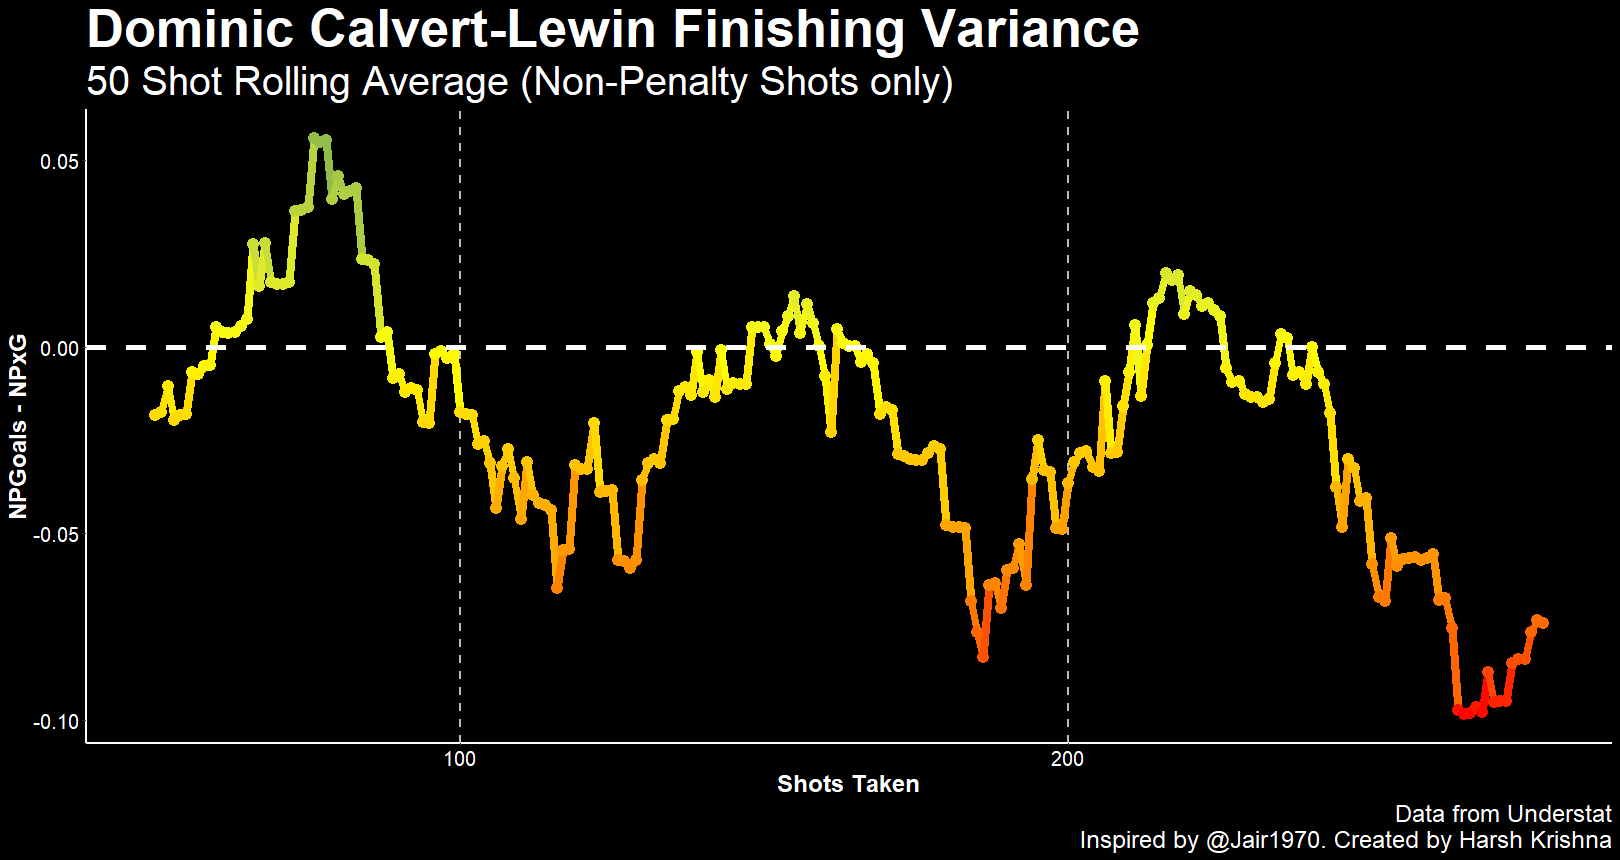
home_color = "#e31a1c", away_color = "#980043", theme = "dark")Plot a Linechart that shows how a players finishing trends over time using Understat data. Code here.
To Create, load the packages, run the function, and run the following line (setting specific parameters) for the final viz.
plot_varline(player_id = 5555, roll_avg = 50, theme = "dark")
