First of all you need to prepare exporter to collect metrics from Oracle:
# Install and configure Prometheus Exporter - https://github.com/iamseth/oracledb_exporter
Run exporter:
# export Oracle location:
export DATA_SOURCE_NAME=system/password@oracle-sid
# or using a complete url:
export DATA_SOURCE_NAME=user/password@//myhost:1521/service
# export location of custom-metrics.toml file
export CUSTOM_METRICS=/path/to/config/custom-metrics.toml
# Then run the exporter
/path/to/binary/oracledb_exporter -l log.level error -l web.listen-address 9161
Or use docker-compose to run exporter:
docker-compose -f docker-compose.yml up -d
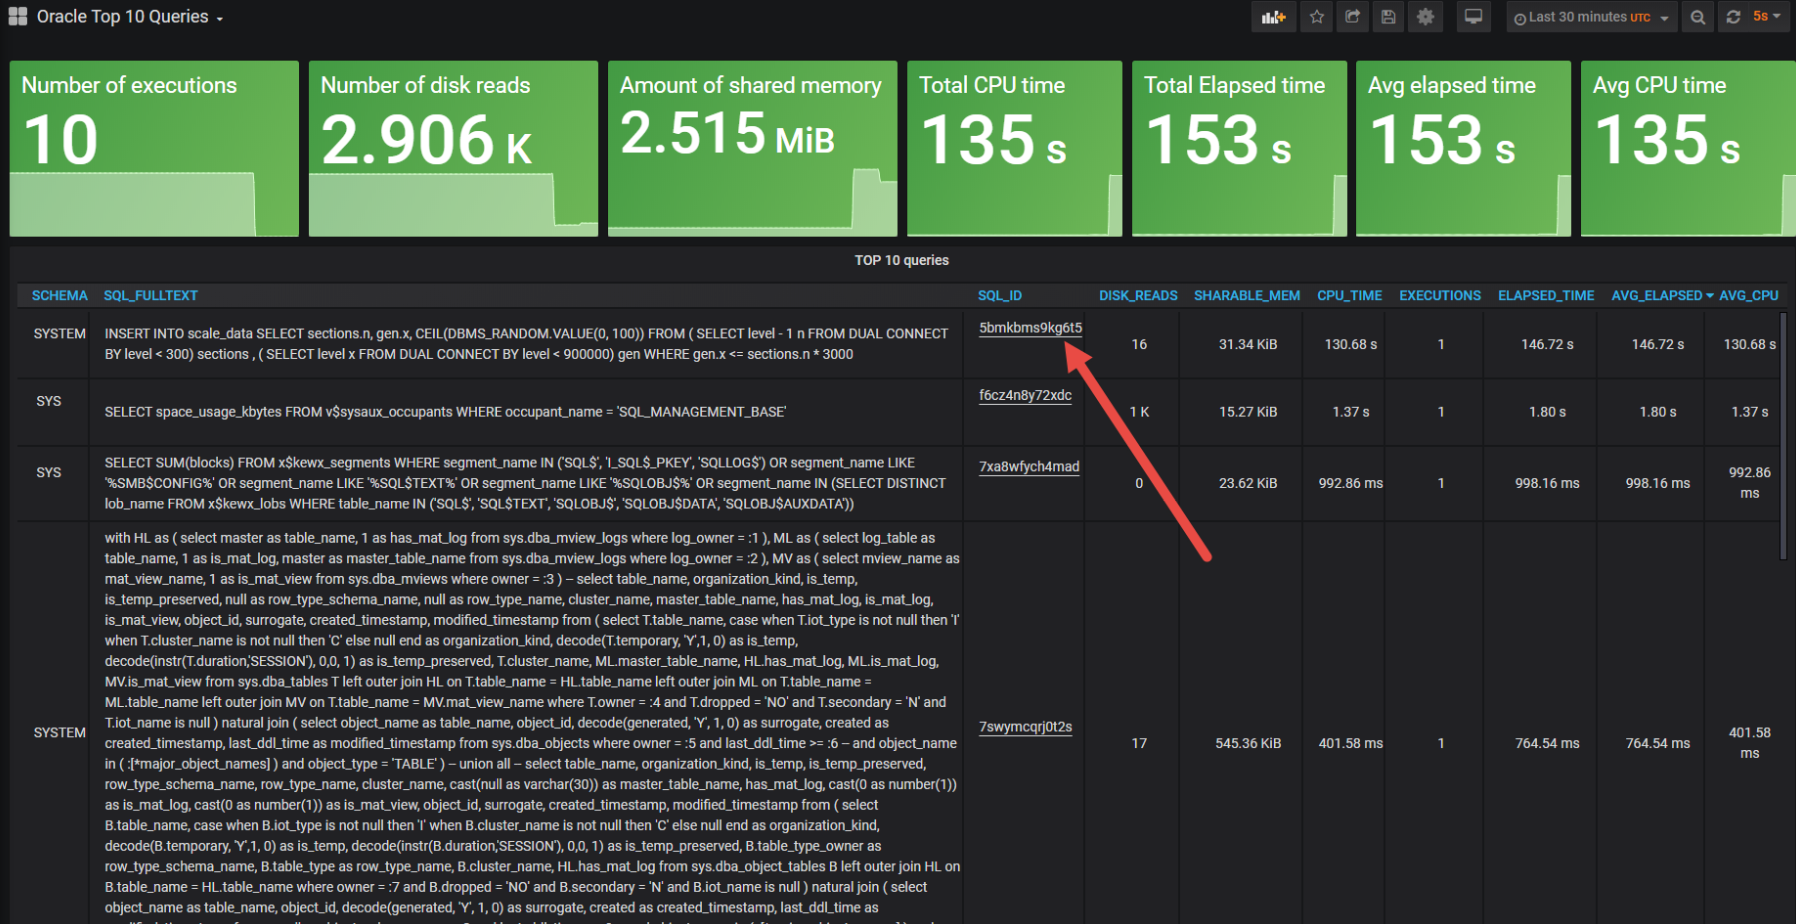
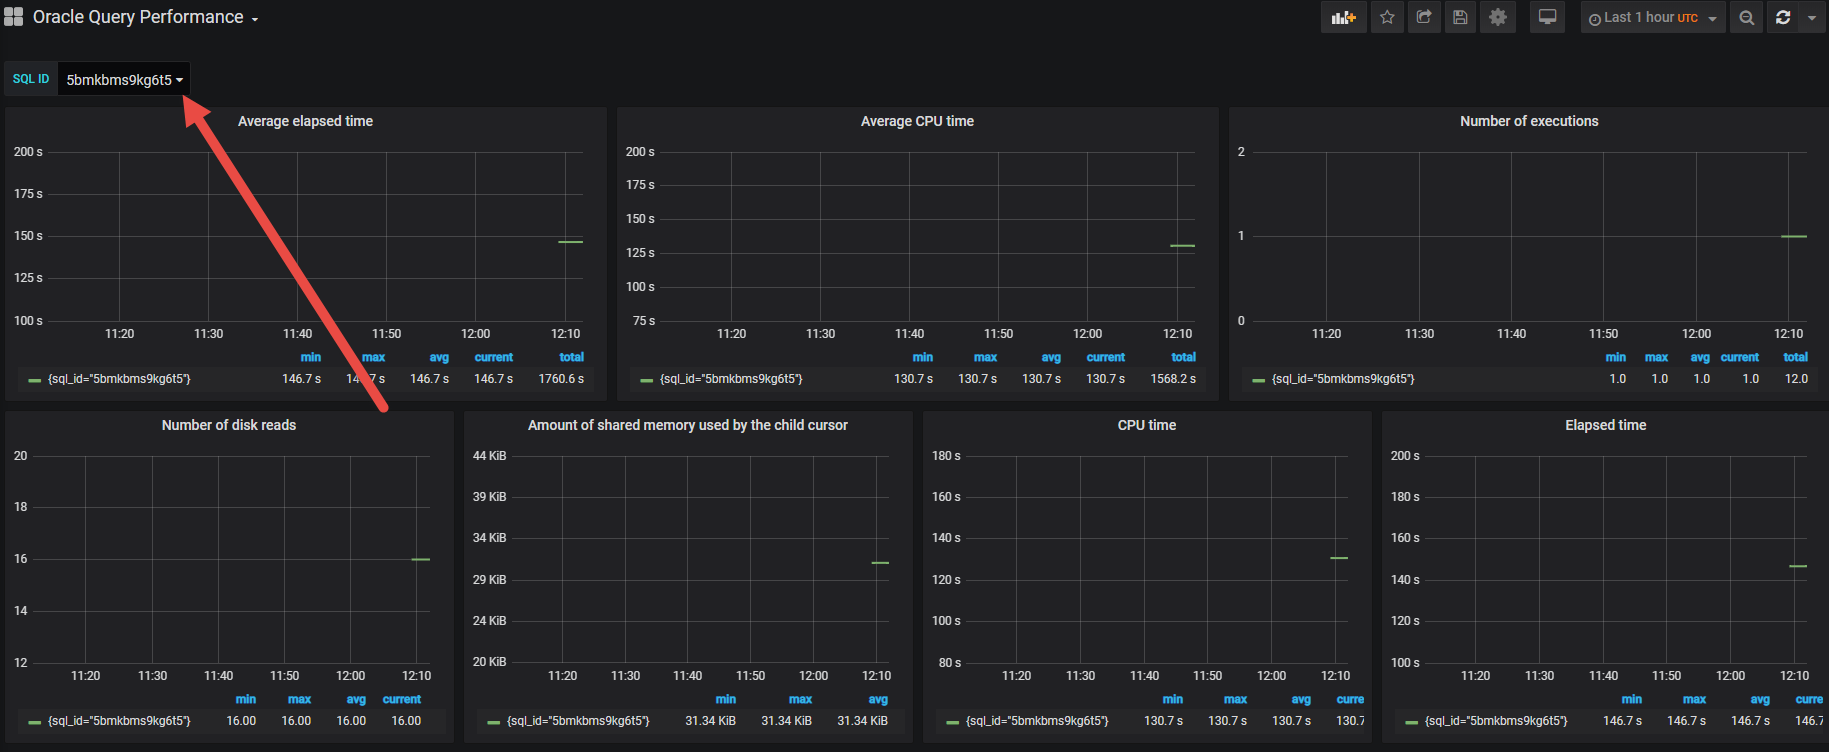
Grafana Dashboards (Some dashboards contain "stat" panel which become available in Grafana Version 6.6):
In dashboards directory you can find two dashboards which should be uploaded to Grafana