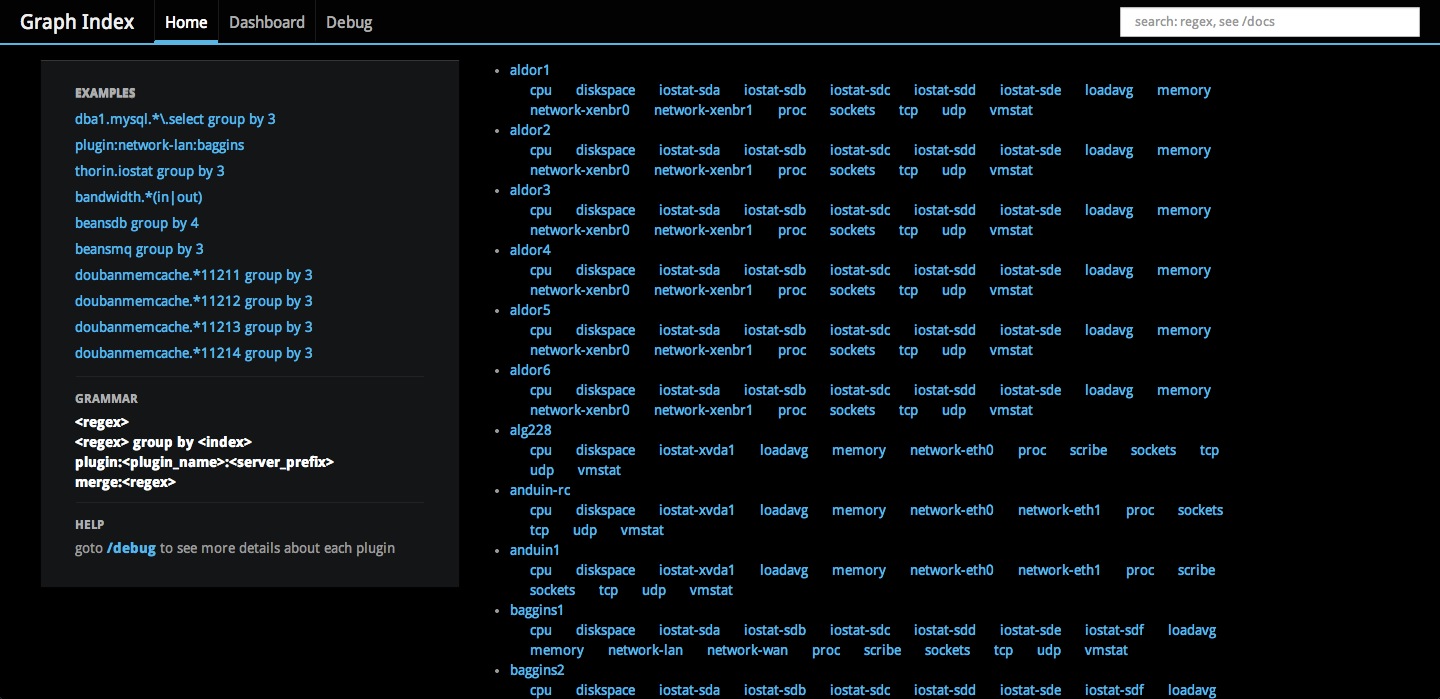
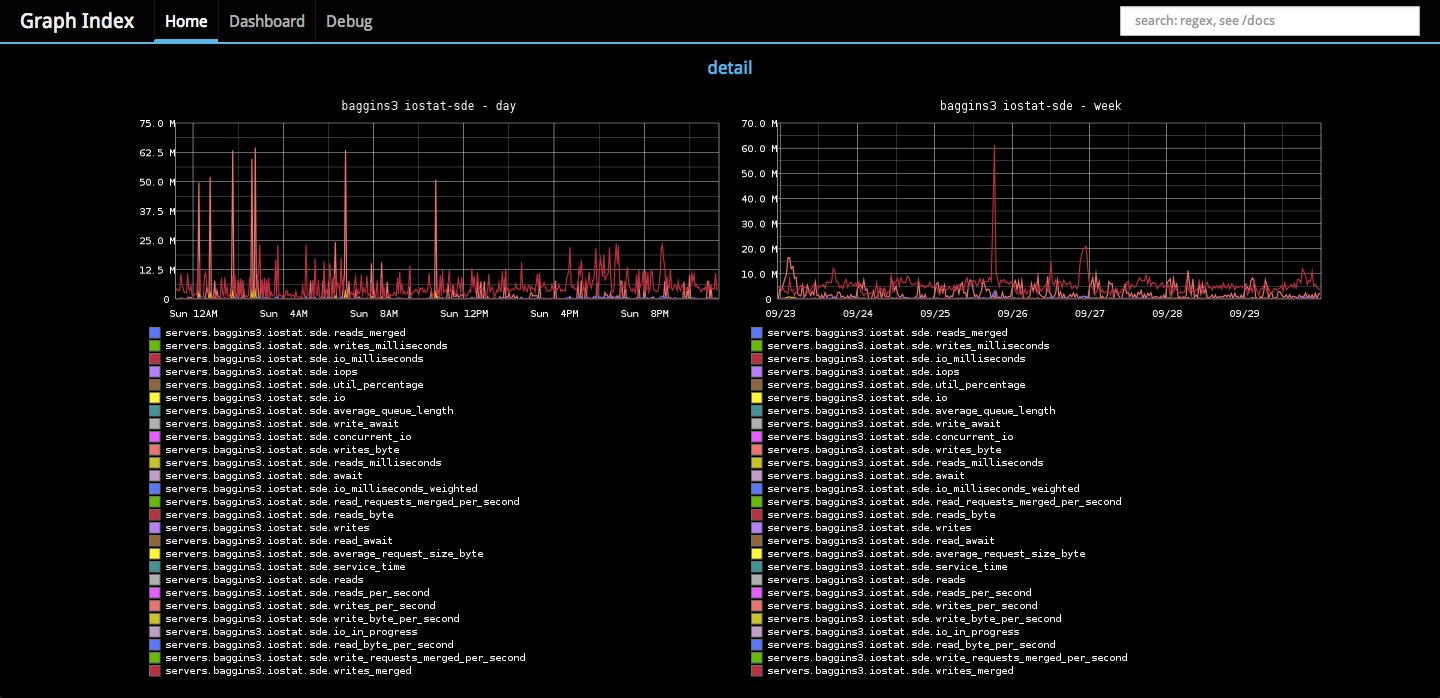
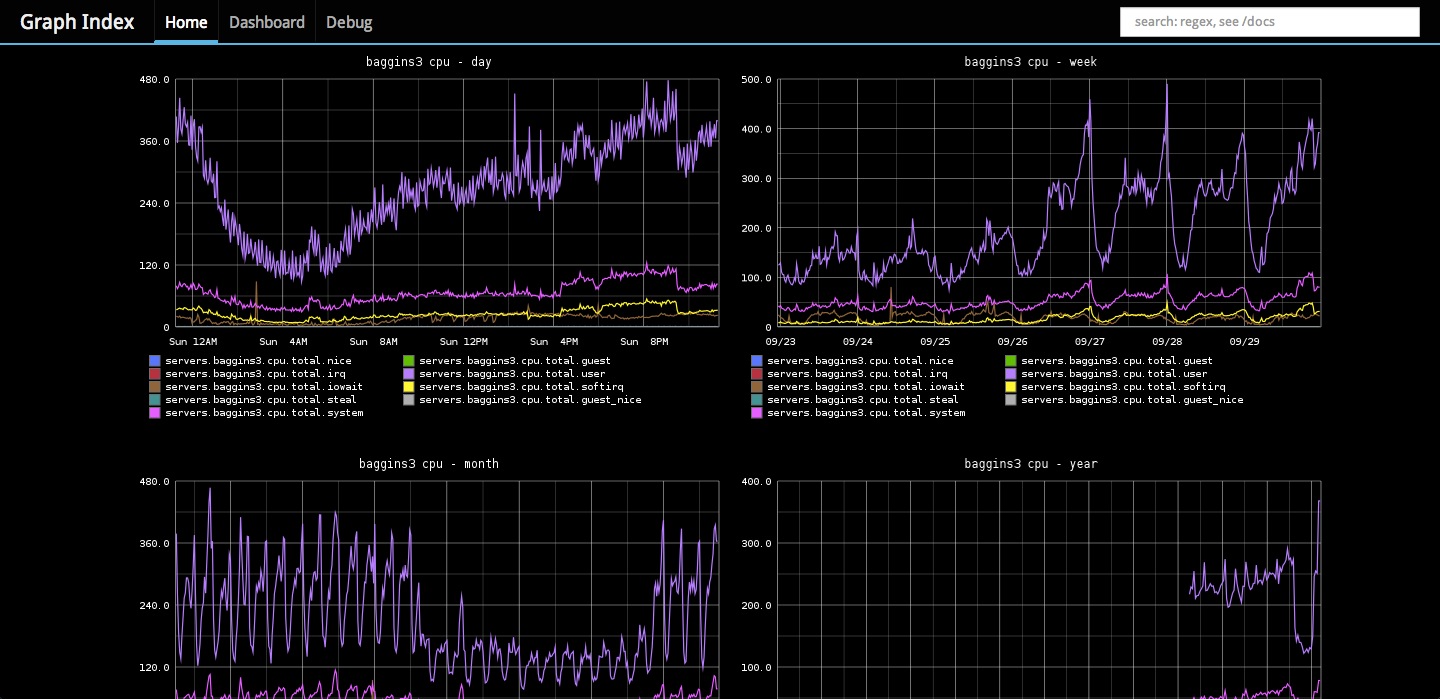
If you are using Graphite & Diamond, graph-index will help you to build a wonderful index view !
- support regex search
- some pre-defined dashboard
- easily hack and a few lines of code
First:
git clone https://github.com/douban/graph-index.git
cd graph-index
edit the config.py to modify graphite_url, in our case it is http://graphite.intra.douban.com
then:
as a dependency, you should add a cron to update metrics like this: crontab -e, and put */5 * * * * python /path/to/update-metrics.py in it
finally:
now everything is ready, we can run it by:
./graph-index.py
graph-index also supports multi-workers with tools like gunicorn, In my case, I started it like this:
cd graph-index
/usr/bin/gunicorn -w 5 app:'default_app()' -b 0.0.0.0:8808
regex will draw a graph for each metric, for example: servers.[^\.]+.loadavg.01$
plugin:server:regex will display a graph with all metrics on hostname,for example: plugin:cpu:hostname
merge:regex will merge matched metrics in a single graph, for example: merge:.*loadavg\.01$
group\s*by\s*\-?\d+ will draw multiple graphs group by the \-?\d+-th field, for example: loadavg\.01$ groupby1


