Table of Contents
- Visual Studio Code Client for Wolfram Language Server
Please be advised to git pull the lastest minor version 0.3.x. There are some breaking changes you want to know more in the server's README.
Wolfram Language Server (WLServer) is an implementation of the Microsoft's Language Server Protocol (LSP) for Wolfram Language. This server is implemented in Wolfram Language itself.
This is the client-side code for VS Code, which is based on some slight modifications of Microsoft's LSP example. However, you still need to manually install the server .
-
Wolfram Mathematica (11.2 or higher1) or Wolfram Engine (12.0 or higher).
-
Download the server from its repository.
git clone https://github.com/kenkangxgwe/lsp-wl.git -
Install the dependent paclets with the correct versions (currently 1.0 or later) from the Wolfram kernel / Mathematica. (This will cost some time for the first time) :
PacletInstall["CodeParser"]
PacletInstall["CodeInspector"]
-
Install the client extenstion from Visual Studio Marketplace: Wolfram Language Server.
Once you have installed the extension, a few settings have to be done manually in the client side to make things work.
After the extension is launched, go to Preference -> Settings -> User Settings -> Extensions -> Wolfram Language Server, and configure the following options:
-
Port: The client communicates with the server through port. Feel free to use any port that is not occupied by other processes. -
WLServer Path: The path to the server repository. -
Wolfram Path: The path of theWolframexecutable. (NOTMathematicaorWolframKernel)
For Windows users, the default path isC:\Program Files\Wolfram Research\Mathematica\11.*\wolfram.exe.
For MaxOS users, the default path is/Applications/Mathematica.app/Contents/MacOS/wolfram.
For Linux users, the default path is/usr/local/Wolfram/Mathematica/11.*/wolfram. -
Diagnostics: MitigatedandDiagnostics: Suppressed: To adjust how some of the diagnostics are reported, see Diagnostics: Override Reporting Rules.
Restart VS Code to take effect.
To enable debugger, you need to add the configuration to the project that you
are working on by clicking on Run -> Add configuration... in the menu. In
the opened .vscode/launch.json file, select Wolfram Debug Adapter: Attach in
the completion list.
Or add the following configuration directly to the launch.json.
"configurations": [
    {
        "type": "dap-wl",
        "request": "attach",
        "name": "Create a new Wolfram Kernel",
        "stopOnEntry": true
    }
]
To start the debugger, jump to the Run tab in the sidebar and select the
configuration name just added and clicked the Start Debugging button.
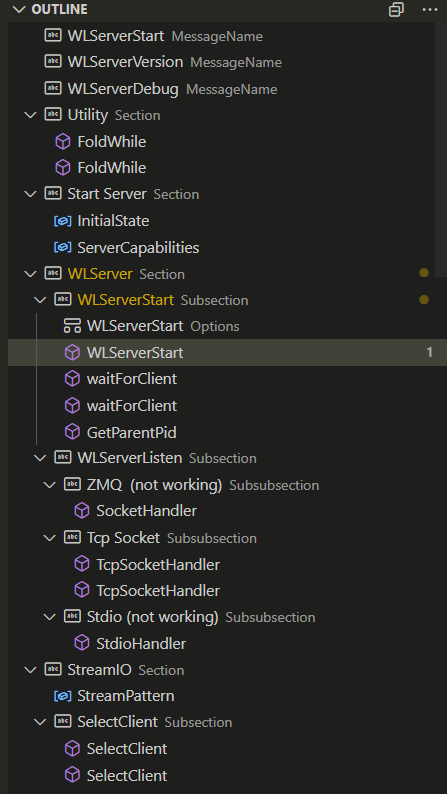
You may typeset your package in the same way that Mathematica FrontEnd handles it: a cell begins with two lines of comments, where the first line specifies the style of the cell and the second line names it. So you may get the outline structure of the file.
(* ::Title:: *)
(*Title of the file*)

(* ::Section:: *)
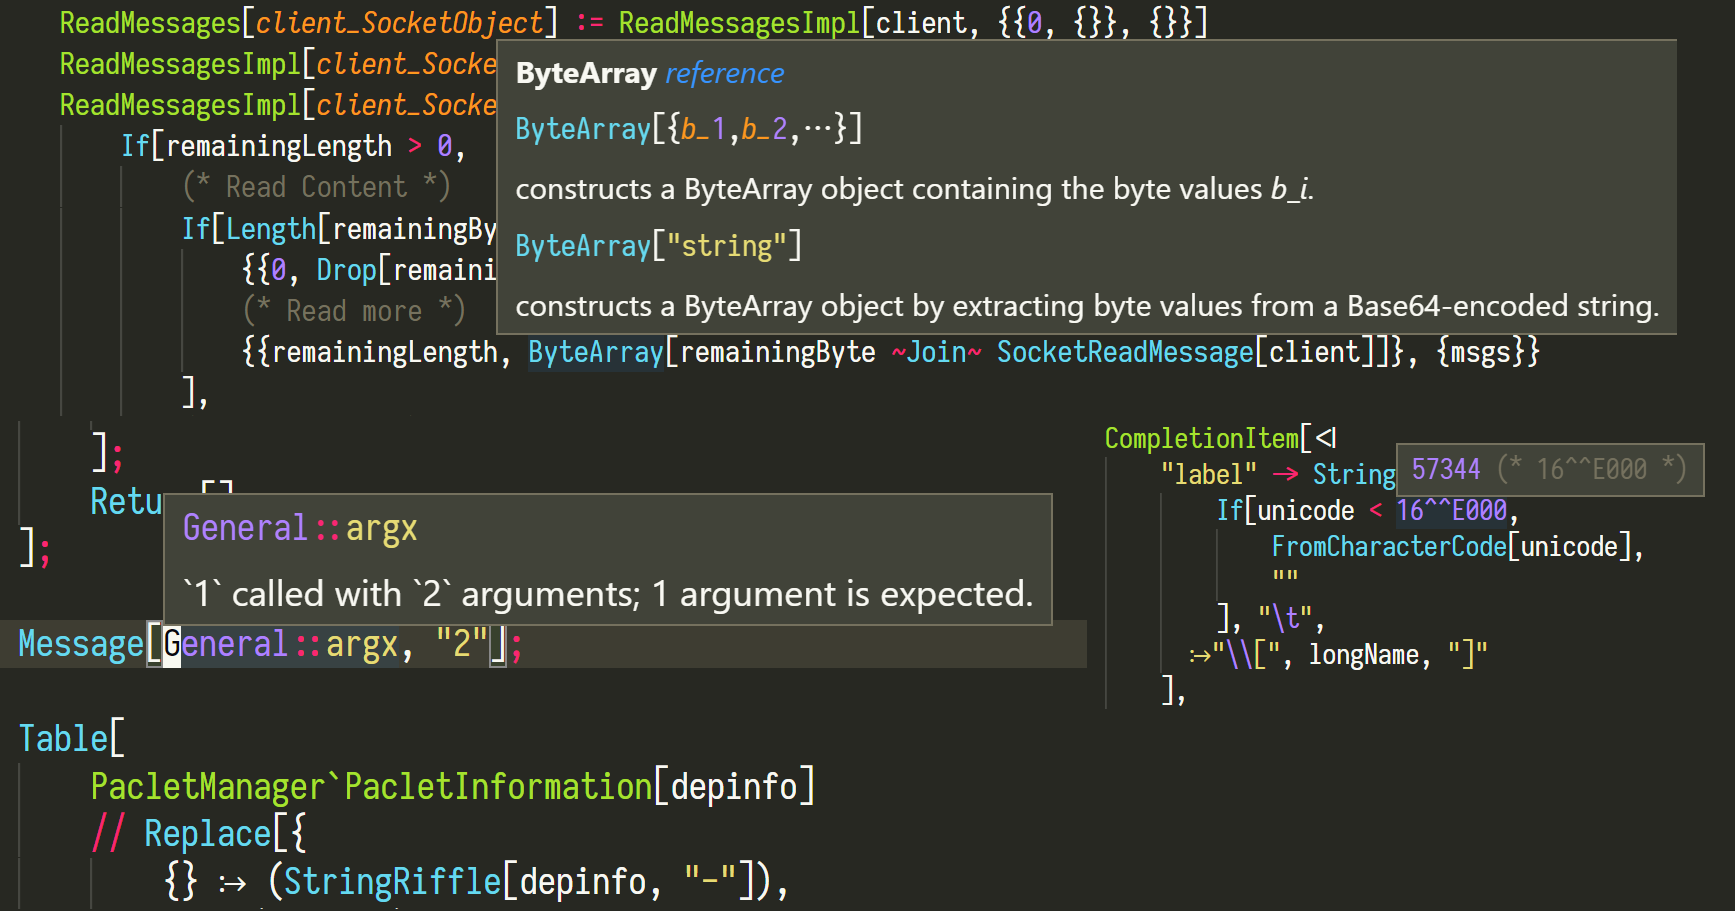
(*Section 1*)Provide documentations for functions and variables from the System`
context, such as String and $Path, the MessageName and the special
numerical literals with ^^ or *^.
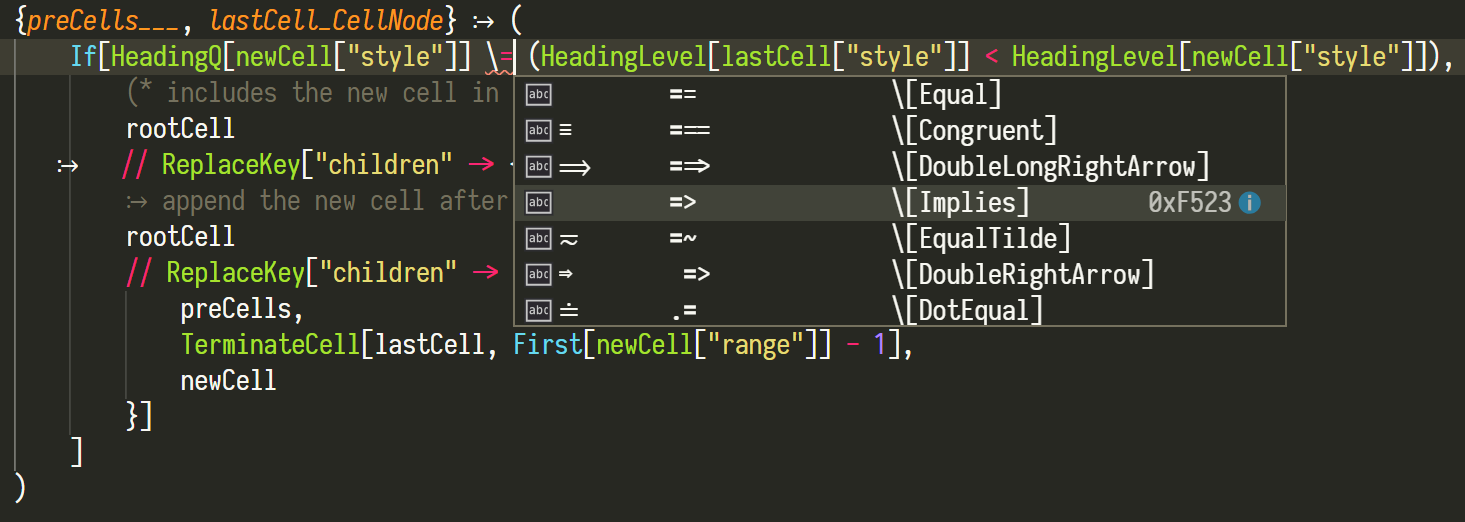
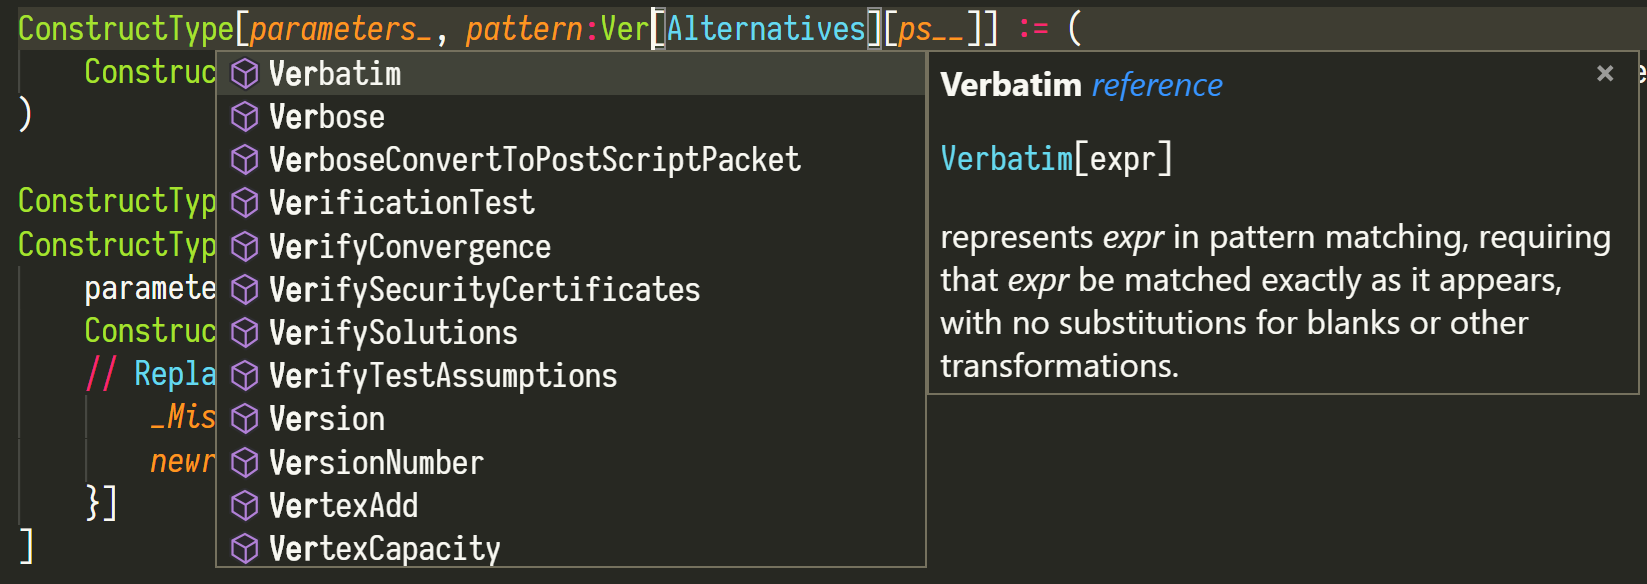
The completion is shown by the client automatically. Functions and system
variables from the System` context that matches the input would be
displayed. To enter an unicode character, you may use the leader key
\ followed by the alias just like esc in Wolfram
FrondEnd. E.g., <esc>a in the FrontEnd is input as \a in the editor and the
server will show you the available completions.
Completion Resolve: Further information (such as documentation) would be provided for the items in the list.
Syntax error would be underlined. This feature is powered by CodeParser and CodeInspector paclets, thank you @bostick.
To adjust how some of the diagnostics are reported, adding their corresponding
tags in the
settings.json. There
are two kinds of ways to override the reporting rule:
Mitigated: The tags under this category will not be considered as an issue, and shown in the lowest severity, i.e. "hint". E.g. In VSCode, this will result in a elipesis under the reporting position but will not listed under theProblemstab.Suppressed: The tags under this category will be completely ignored and not reported.
An example of configuration in settings.json is shown below:
{
    // ...
    "WolframLanguageServer.Diagnostics.mitigated": [
        "ExperimentalSymbol",
        "UnusedParameter",
        "UnusedVariable",
    ],
    "WolframLanguageServer.Diagnostics.suppressed": [
        "DifferentLine",
        "SuspiciousSessionSymbol",
    ],
    // ...
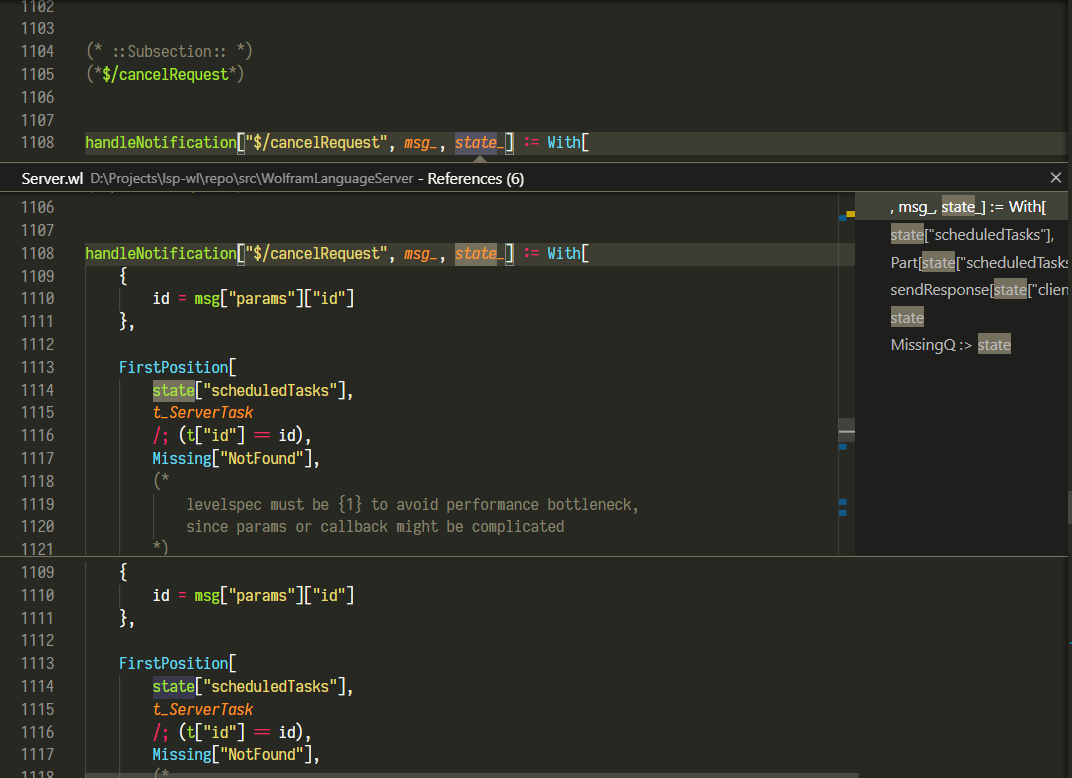
}It is now able to look up the definition and references of a local variable in a
scope such as Module or pattern rules.
Code action is now able to,
-
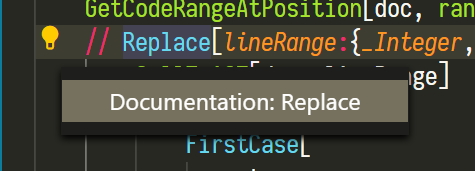
Open the documentation of system symbols in Mathematica (Not available for Wolfram Engine).
-
Evaluate the selected code if debugger is running. See Evaluate.
Both Named Colors and
Color Models with constant parameters are able to show and modify.
(Experimental, may have performance issues.)
This is under development, so more features are on the way. Notice that, syntax highlight will NOT be provided as long as it is excluded in the LSP, but there are already some good enough extensions written by Flip Phillips and by shigma.
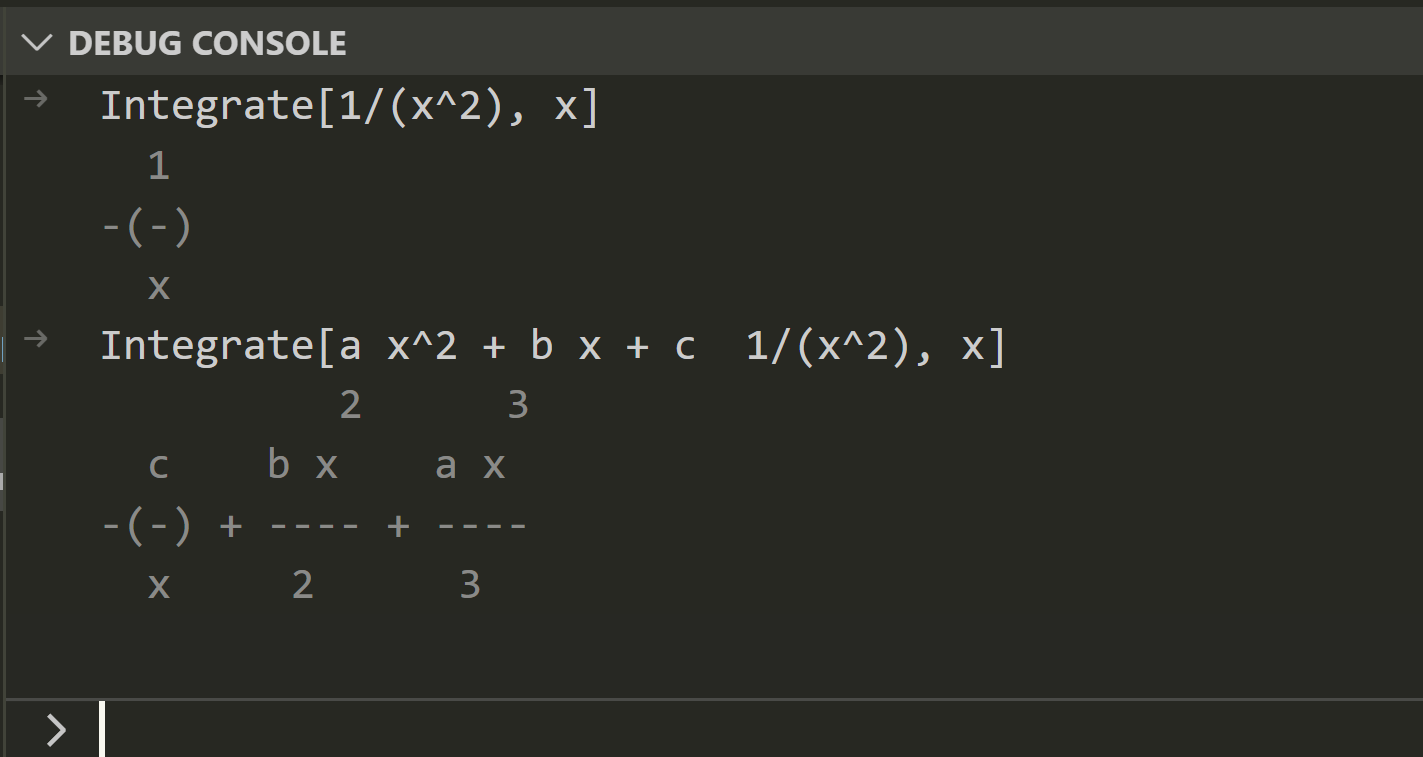
Code evaluation can be run from the code action of the selection or code lens below each section title. The results are usually shown in the debug console on the editor side.
Expressions can also be directly input from the debug console.
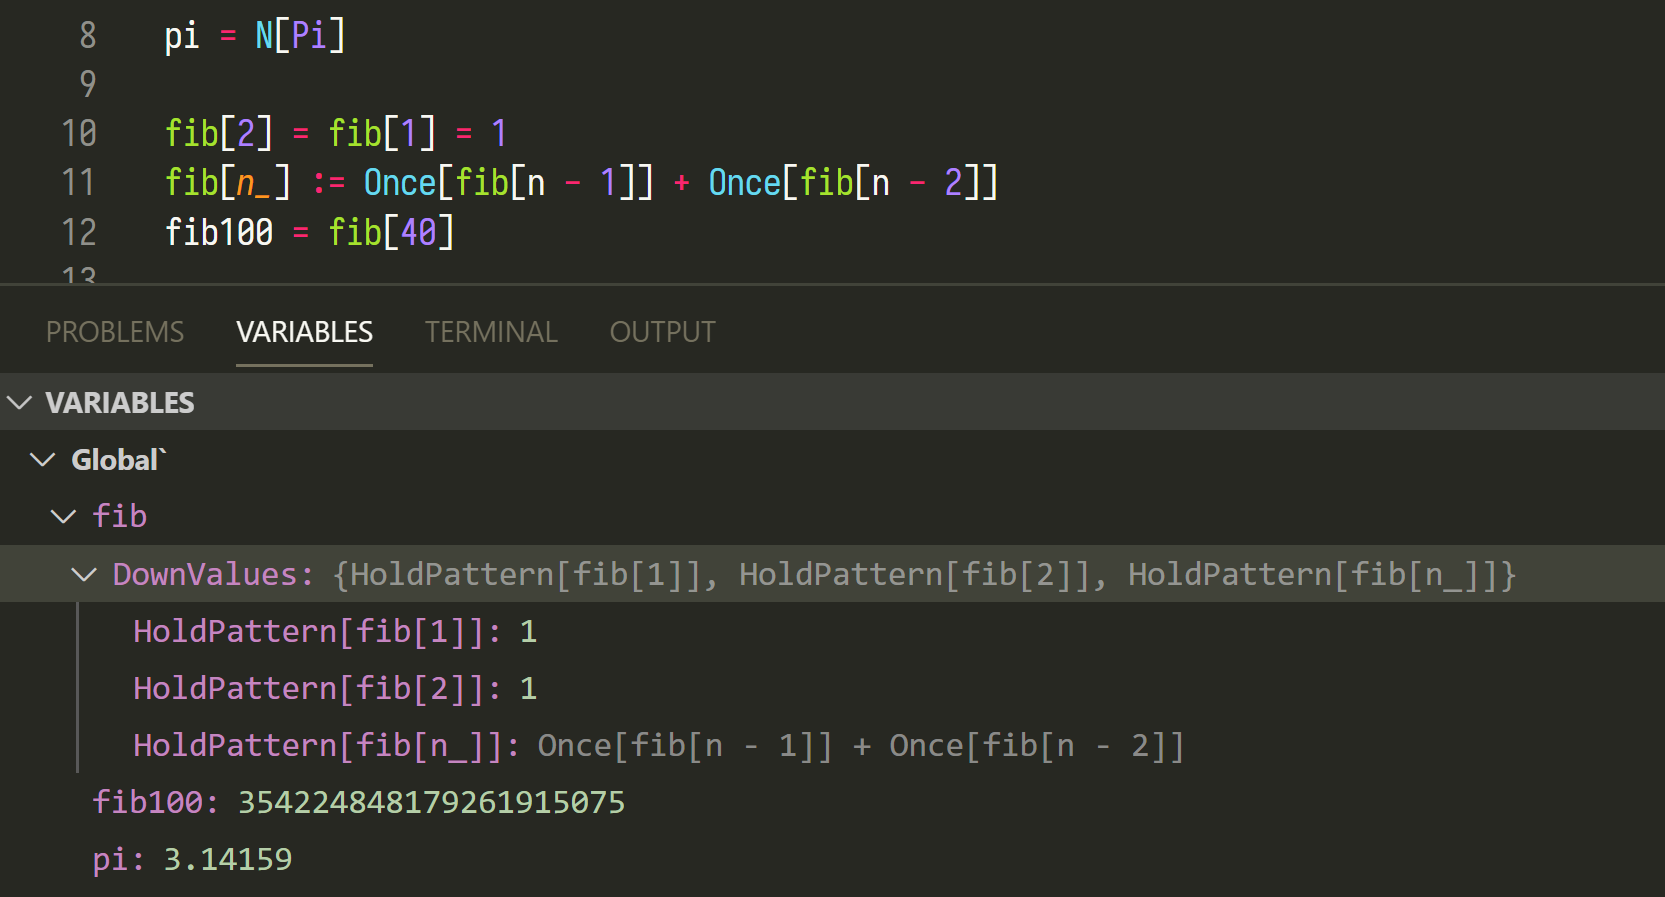
After evaluation, the symbol values can be retrieved from the editor. This includes the own values of variables and the down/up/sub values of functions defined.
The behavior of the variables mimics the workspace in MATLAB, so all the symbols
defined in the debug console as well as evaluated from the file will be
recorded. This also includes contexts other than Global` . The editor can
also watch on a specific expression after each evaluation if applicable.
[1] SocketListen[] is used for server-client
communication, which is introduced since 11.2. ^


