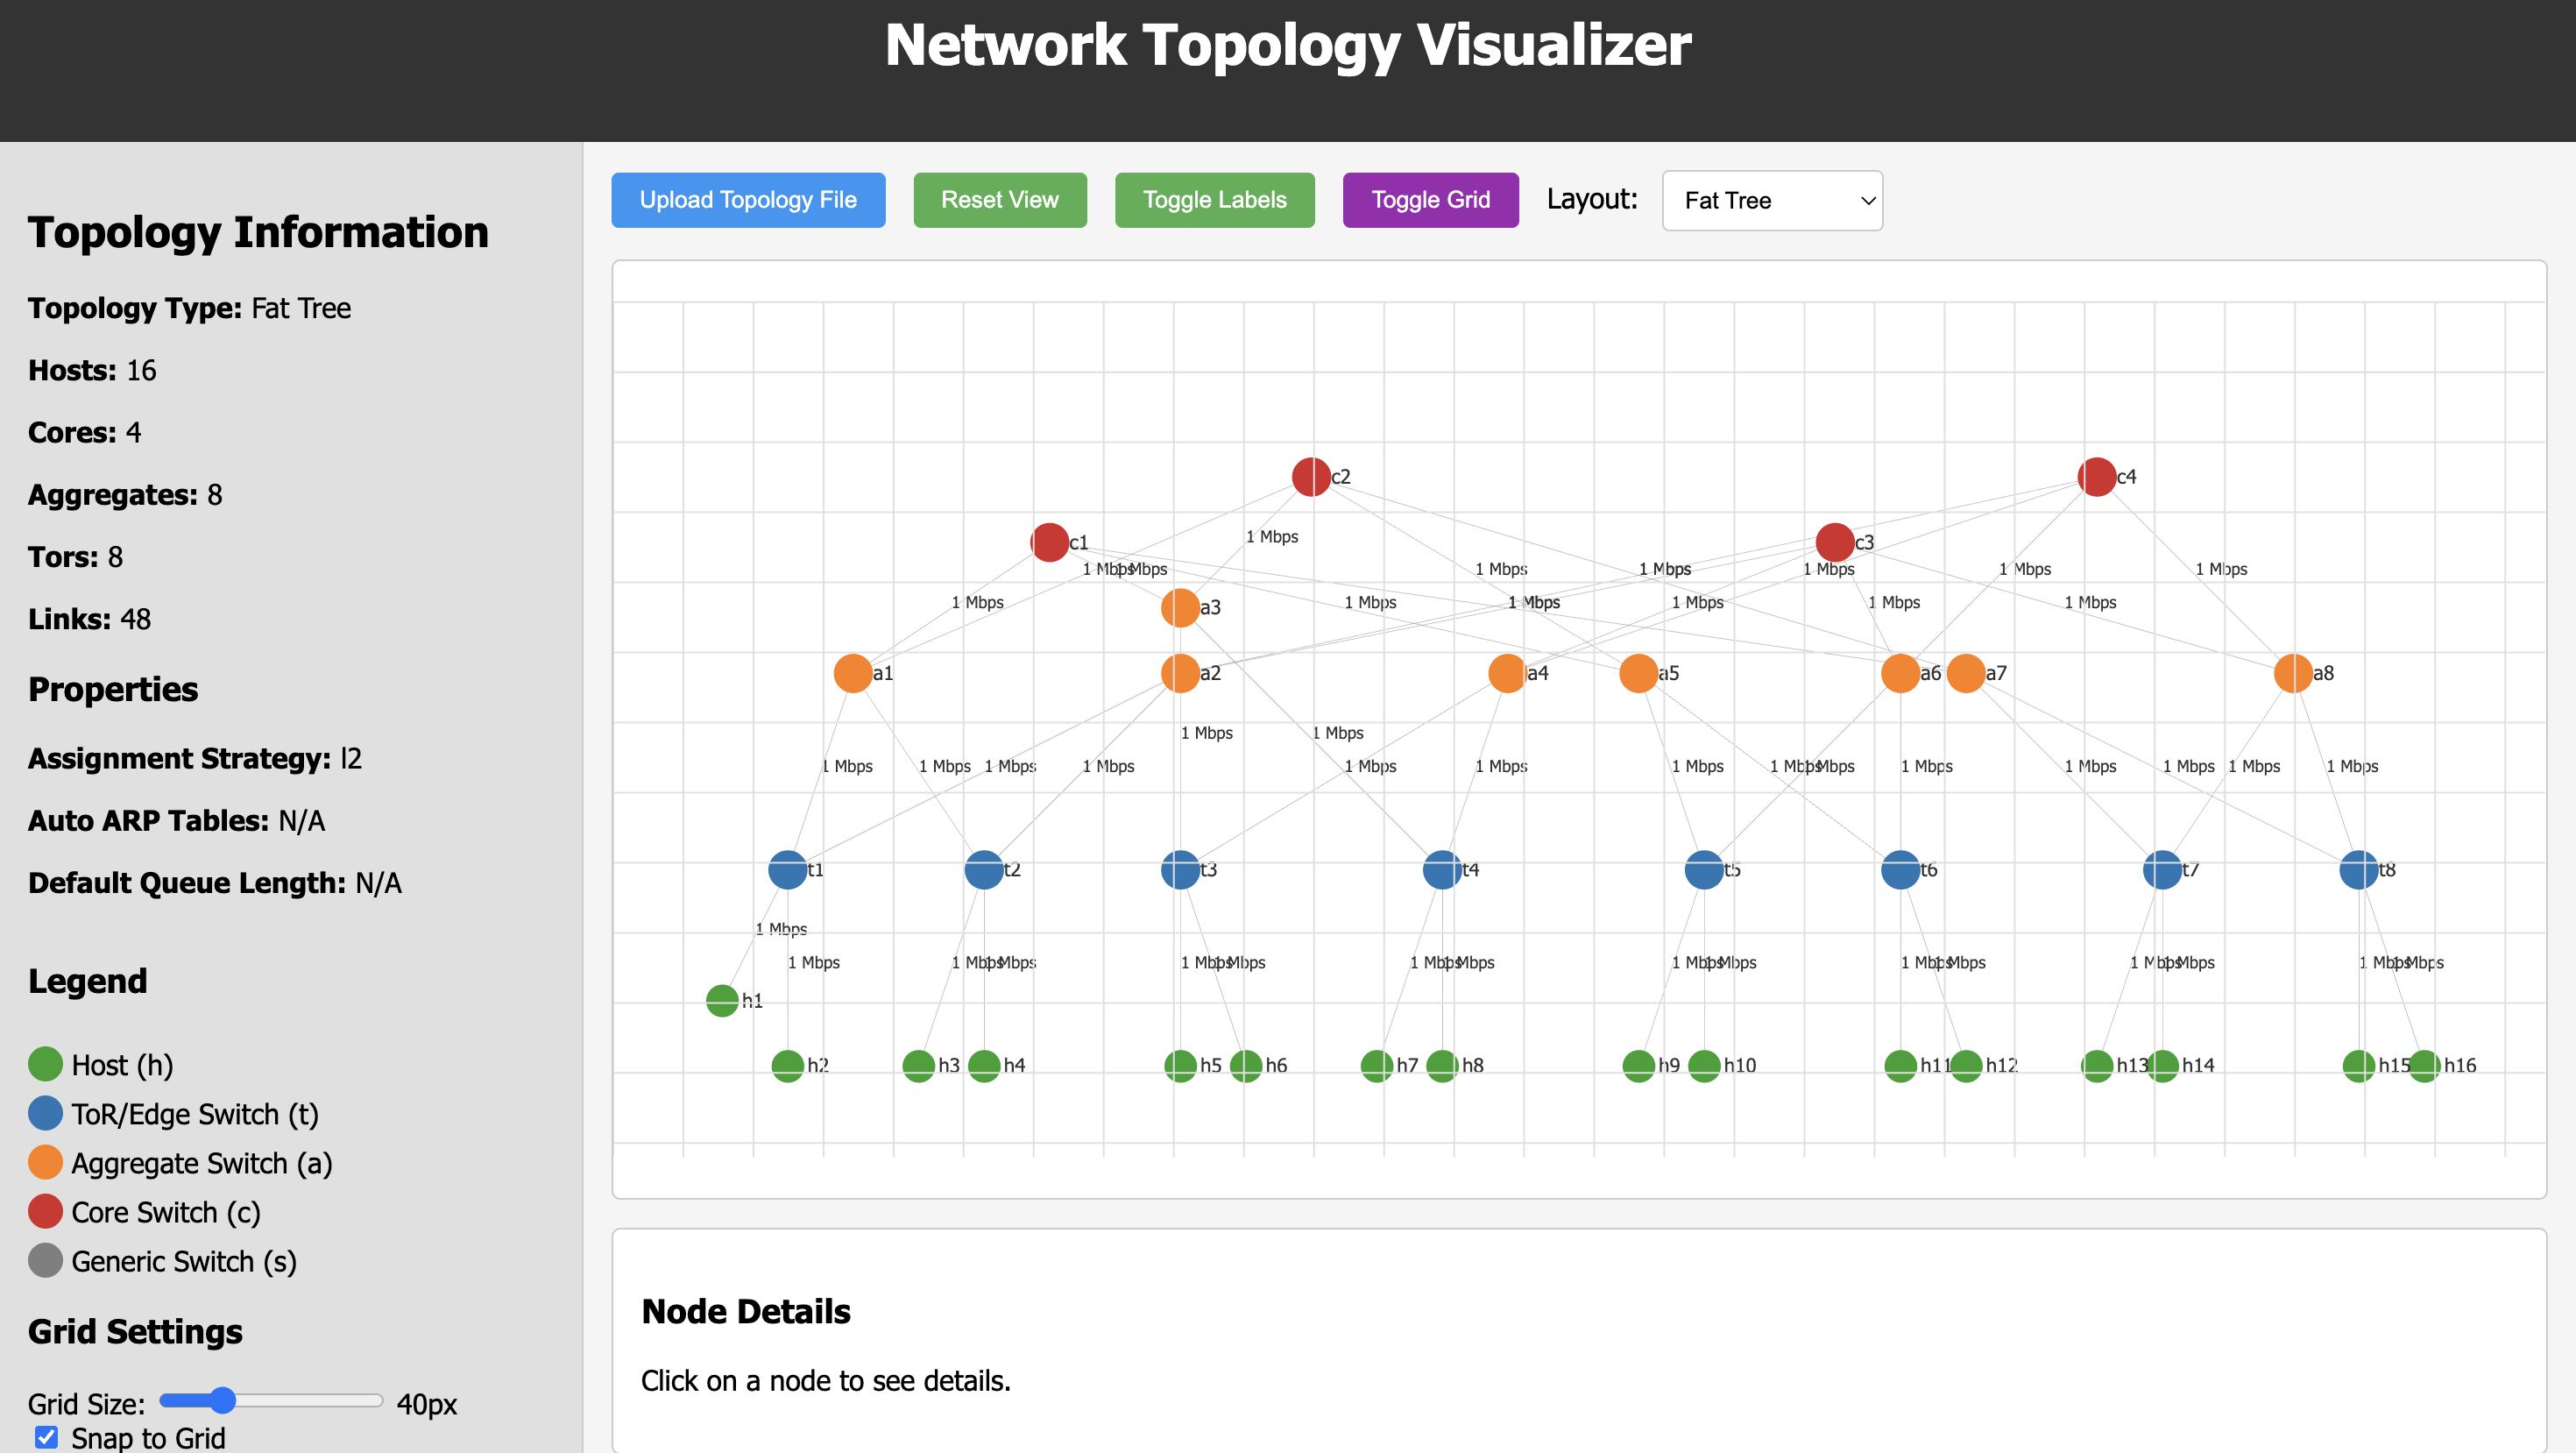
A powerful web-based tool for visualizing, creating, and editing network topology files. This visualizer automatically detects and renders different types of network topologies, including Fat Trees, Binary Trees, and more.
- Automatic Topology Detection: Intelligently identifies topology types (Fat Tree, Binary Tree, Linear, etc.)
- Multiple Layout Algorithms: Optimized visualization for different network architectures
- Interactive Interface: Drag, zoom, and click nodes to inspect network elements
- Network Builder: Add, remove, and connect nodes without writing any JSON
- Bandwidth Visualization: Shows bandwidth information on links when available
- Grid System: Snap-to-grid functionality with adjustable grid size for clean, organized layouts
- Customizable View: Toggle labels, grid lines, and adjust display settings
- Detailed Information: View comprehensive node configuration and connection details
- Port Information: Shows connection port numbers for each link
- Export Options: Save your topology as PNG, JPEG, or JSON
- Network Configuration: Customize assignment strategy, ARP tables, and queue length
-
Clone this repository:
git clone https://github.com/kevingreencode/visualizer.git -
Navigate to the project directory:
cd visualizer -
Open
index.htmlin your preferred web browser:firefox index.html # or chrome index.html # or any other browser
No server-side components or build steps required - this is a pure HTML/CSS/JavaScript application.
- Click the "Upload Topology File" button
- Select a JSON topology file
- The system will automatically detect the topology type and display it using the most appropriate layout
-
Add Nodes:
- Enter a node ID in the "Node ID" field (follow naming conventions: h for hosts, t for ToR switches, etc.)
- Select the node type from the dropdown
- Click "Add Node"
-
Add Links:
- Select source and target nodes from the dropdowns
- Optionally set bandwidth (in Mbps)
- Click "Add Link"
-
Remove Elements:
- Click on a node or link to select it
- Click "Remove Selected" to delete it
- Use "Remove Links" to clear all connections while keeping nodes
- Use "Clear All" to remove everything and start over
- Assignment Strategy: Choose between L2 and L3
- Auto ARP Tables: Toggle automatic ARP table generation
- Default Queue Length: Set the default queue length for the network
- Pan: Click and drag on empty space
- Zoom: Use mouse wheel or trackpad gestures
- Move Nodes: Drag individual nodes to reposition them
- View Details: Click on any node or link to see its configuration and connections
- Format View: Click "Format View" to reset layout while maintaining topology structure
- Toggle Labels: Show/hide node and bandwidth labels
- Toggle Grid: Show/hide the background grid
- Change Layout: Select a different algorithm from the layout dropdown
- Adjust Grid Size: Use the slider to change grid granularity (20px-100px)
- Snap to Grid: Toggle grid snapping for precise alignment
- Export as PNG: Save the visualization as a PNG image
- Export as JPEG: Save the visualization as a JPEG image
- Export as JSON: Save the topology configuration as a JSON file (for later import)
Optimized for hierarchical datacenter topologies with core, aggregate, and top-of-rack (ToR) layers.
{
  "topology": {
    "links": [["c1", "a1"], ["a1", "t1"], ["t1", "h1"]],
    "hosts": { "h1": {} },
    "switches": { "c1": {}, "a1": {}, "t1": {} },
    "assignment_strategy": "l3",
    "auto_arp_tables": true,
    "default_queue_length": 100
  }
}Visualizes binary tree topologies with multiple levels (a, b, c, d) connected in a tree structure.
{
  "topology": {
    "links": [["a1", "b1"], ["a1", "b2"], ["b1", "c1"], ["b1", "c2"]],
    "hosts": { "h1": {} },
    "switches": { "a1": {}, "b1": {}, "b2": {}, "c1": {}, "c2": {} }
  }
}Displays simple topologies with linear connections between switches and hosts.
{
  "topology": {
    "links": [["h1", "s1"], ["s1", "s2"], ["s2", "h2"]],
    "hosts": { "h1": {}, "h2": {} },
    "switches": { "s1": {}, "s2": {} }
  }
}A fallback layout for custom or complex topologies that don't match standard patterns.
- Assignment Strategy: Choose between L2 and L3 network protocols
- Auto ARP Tables: When enabled, ARP tables are automatically generated
- Default Queue Length: Specify the default queue length for all links
- Grid Size: Controls the spacing between grid lines (20px-100px)
- Snap to Grid: When enabled, nodes will align to the nearest grid intersection
- Auto Detect: Automatically selects the best layout based on topology structure
- Fat Tree: Forces the fat tree layout algorithm
- Binary Tree: Forces the binary tree layout algorithm
- Linear: Forces the linear layout algorithm
- Force-Directed (Ugliness): Uses a physics-based layout for custom topologies
- Host (h): Green
- ToR/Edge Switch (t): Blue
- Aggregate Switch (a): Orange
- Core Switch (c): Red
- Generic Switch (s): Gray
The visualizer is built using a modular architecture with the following core components:
- Parser Module: Reads and validates JSON topology files
- Detection Engine: Analyzes topology structure and assigns layout algorithms
- Layout Engine: Implements multiple layout algorithms for different topology types
- Rendering Engine: Handles SVG-based visualization using D3.js
- Interaction System: Manages user inputs (drag, zoom, click) and updates
- Network Builder: Handles the creation and modification of topology elements
- Export System: Manages various export formats (PNG, JPEG, JSON)
- D3.js v7: For data-driven DOM manipulation and SVG rendering
- CSS3: For styling and transitions
- Vanilla JavaScript: For application logic and topology processing
- SVG: For scalable vector graphics and network visualization
- Data-Driven Approach: D3's data binding pattern allows us to efficiently map topology data to visual elements
- Force Simulation: Built-in physics engine for natural node positioning and animations
- DOM Manipulation: Efficient enter/update/exit pattern for managing dynamic network elements
- Event Handling: Powerful event system for interactive features like dragging and zooming
- Ecosystem: Rich ecosystem of plugins and examples for network visualization
- Scalability: SVG graphics scale without loss of quality at any zoom level
- DOM Integration: Each node and link can be individually styled and manipulated
- Performance: Hardware acceleration for smooth animations and interactions
- Flexibility: Custom shapes and icons can be defined programmatically
- Accessibility: SVG elements can include semantic information for screen readers
// 1. Topology Loading or Creation
handleFileUpload() → loadTopology() → buildGraph()
addNewNode() → updateTopologyInfo() → addNodeToVisualization()
addNewLink() → updateTopologyInfo() → addLinkToVisualization()

// 2. Layout Calculation
applyFatTreeLayout() / applyBinaryTreeLayout() / etc.

// 3. Rendering
visualizeGraph() → SVG Updates

// 4. User Interaction
dragstarted() → dragged() → dragended()
showNodeDetails() / showLinkDetails()

// 5. Export
exportTopologyAsJson() / exportTopology('png') / exportTopology('jpeg')loadTopology(data)
- Extracts topology data from uploaded JSON
- Initiates automatic layout detection
- Triggers UI updates and visualization
buildGraph(topology)
- Transforms raw topology data into node and link objects
- Assigns port numbers based on link order
- Creates data structures for D3 visualization
visualizeGraph(graph)
- Core rendering function using D3's data binding
- Creates SVG elements for nodes and links
- Sets up force simulation and interaction handlers
- Manages the enter/update/exit pattern for dynamic updates
detectTopologyType(graph, topology)
- Analyzes node naming patterns and structure
- Uses priority-based algorithm to classify topology type
- Returns appropriate layout strategy
addNewNode() / addNewLink()
- Validates user input for node/link creation
- Updates topology data structures
- Integrates new elements into visualization
showNodeDetails() / showLinkDetails()
- Displays detailed information about selected elements
- Shows configuration, port numbers, and connection details
Force Simulation Functions
d3.forceSimulation(graph.nodes)
    .force('link', d3.forceLink(graph.links))     // Spring forces between connected nodes
    .force('charge', d3.forceManyBody())          // Repulsion forces
    .force('x', d3.forceX())                      // Horizontal positioning
.force('y', d3.forceY()) // Vertical positioning-
SVG Initialization: Create base SVG container with zoom behavior
svg = d3.select('#graph-container')
    .append('svg')
    .call(d3.zoom().on('zoom', handleZoom));
-
Data Binding: Link data to DOM elements
const nodeGroup = svg.selectAll('.node-group')
    .data(graph.nodes)
    .enter()
    .append('g');
-
Visual Element Creation: Add shapes and paths
// Add icon backgrounds
nodeGroup.append('circle')
    .attr('class', 'node')
    .attr('r', 14)
    .attr('fill', getNodeColor);

// Add custom icons
nodeGroup.append('path')
    .attr('d', icon.path)
    .attr('class', 'node-icon')
    .attr('fill', '#ffffff');
-
Animation Loop: Update positions every frame
simulation.on('tick', () => {
    // Update positions with grid snapping if enabled
    if (snapToGrid) {
        graph.nodes.forEach(d => {
            if (!d.isDragging) {
                d.x = Math.round(d.x / gridSize) * gridSize;
                d.y = Math.round(d.y / gridSize) * gridSize;
            }
        });
    }

    // Update visual elements
    link
        .attr('x1', d => d.source.x)
        .attr('y1', d => d.source.y)
        .attr('x2', d => d.target.x)
        .attr('y2', d => d.target.y);

    nodeGroup
        .attr('transform', d => `translate(${d.x}, ${d.y})`);
});
function detectTopologyType(graph, topology) {
    // Count node types and prefixes
    const nodeTypeCount = {};
    const prefixCounts = {};

    graph.nodes.forEach(node => {
        nodeTypeCount[node.type] = (nodeTypeCount[node.type] || 0) + 1;
        const prefix = node.id.charAt(0);
        prefixCounts[prefix] = (prefixCounts[prefix] || 0) + 1;
    });

    // Priority-based detection
    if (prefixCounts['b']) return 'binary';  // Binary trees have unique 'b' prefix

    const hasFatTreeNaming = (prefixCounts['c'] && prefixCounts['a'] && prefixCounts['t']) ||
        (nodeTypeCount['core'] && nodeTypeCount['aggregate'] && nodeTypeCount['tor']);
    if (hasFatTreeNaming) return 'fattree';

    const hasSimpleNaming = prefixCounts['s'] && prefixCounts['s'] < 10;
    if (hasSimpleNaming) return 'linear';

    return 'force';  // Fallback to force-directed
}Fat Tree Layout:
- Calculates horizontal layers for core, aggregate, and ToR switches
- Uses mathematical spacing to organize nodes in strict linear patterns
- Groups hosts under their connected ToR switches
- Adapts spacing based on topology size
Binary Tree Layout:
- Extracts hierarchy levels based on node naming conventions (a, b, c, d)
- Organizes levels vertically with mathematical spacing
- Positions nodes horizontally within each level
Linear Layout:
- Arranges switches in a horizontal line
- Places hosts connected to each switch below them
- Maintains consistent vertical spacing
Force-Directed Layout:
- Uses D3's force simulation with multiple forces (link, charge, center)
- Applies spring and repulsion forces for natural positioning
- Allows dynamic adjustment based on network density
// Add a new node to the topology
function addNewNode() {
    const nodeId = document.getElementById('node-id').value.trim();
    const nodeType = document.getElementById('node-type').value;

    // Validation checks
    if (!nodeId) {
        alert('Please enter a node ID.');
        return;
    }

    // Check if ID already exists
    if (graph.nodes.some(node => node.id === nodeId)) {
        alert(`Node with ID "${nodeId}" already exists.`);
        return;
    }

    // Add to topology data
    if (nodeType === 'host') {
        if (!currentTopology.hosts) currentTopology.hosts = {};
        currentTopology.hosts[nodeId] = {};
    } else {
        if (!currentTopology.switches) currentTopology.switches = {};
        currentTopology.switches[nodeId] = {};
    }

    // Create node object
    const newNode = {
        id: nodeId,
        type: nodeType,
        config: {},
        ports: {}
    };

    // Assign position
    newNode.x = graph.lastDropPos.x;
    newNode.y = graph.lastDropPos.y;
    newNode.fx = newNode.x;
    newNode.fy = newNode.y;

    // Update graph
    graph.nodes.push(newNode);
    updateNodeDropdowns();
    addNodeToVisualization(newNode);
}// Export topology as image
function exportTopology(format) {
// Add white background
const tempBg = svg.insert('rect', ':first-child')
.attr('width', '100%')
.attr('height', '100%')
.attr('fill', 'white');
// Get SVG content
const svgData = new XMLSerializer().serializeToString(svgElement);
// Create canvas
const canvas = document.createElement('canvas');
const ctx = canvas.getContext('2d');
canvas.width = rect.width;
canvas.height = rect.height;
// Draw SVG to canvas
const img = new Image();
img.onload = function() {
ctx.fillStyle = 'white';
ctx.fillRect(0, 0, canvas.width, canvas.height);
ctx.drawImage(img, 0, 0, canvas.width, canvas.height);
// Convert to image format
const dataURL = canvas.toDataURL(format === 'jpeg' ? 'image/jpeg' : 'image/png');
// Download
const link = document.createElement('a');
link.download = `network-topology.${format}`;
link.href = dataURL;
link.click();
};
img.src = URL.createObjectURL(new Blob([svgData], {type: 'image/svg+xml'}));
}
// Export topology as JSON
function exportTopologyAsJson() {
const jsonData = { topology: currentTopology };
const jsonString = JSON.stringify(jsonData, null, 2);
// Create download link
const blob = new Blob([jsonString], { type: 'application/json' });
const url = URL.createObjectURL(blob);
const link = document.createElement('a');
link.href = url;
link.download = 'network-topology.json';
link.click();
}{
id: "s1",
type: "switch", // host, tor, aggregate, core, switch
config: {}, // Custom configuration from topology
ports: {}, // Port number assignments
x, y: number, // Current position
fx, fy: number, // Fixed position (when dragged)
layoutX, layoutY: number, // Calculated layout position
isDragging: boolean // Flag for dragging state
}{
source: "s1",
target: "s2",
sourcePort: 1, // Source port number
targetPort: 1, // Target port number
properties: { // Link properties (bandwidth, etc.)
bw: 4
}
}The visualizer implements a sequential port assignment system:
- Ports are numbered starting from 1
- Port numbers are assigned based on the order links appear in the JSON
- Each node maintains a port counter that increments for each connection
- Port information is displayed in the node details panel
// Get next available port number
function getNextPortNumber(nodeId) {
    const node = graph.nodes.find(n => n.id === nodeId);
    if (!node) return 1;

    // Get used port numbers
    const usedPorts = Object.values(node.ports);
    if (usedPorts.length === 0) return 1;

    // Next available port number
    return Math.max(...usedPorts) + 1;
}- Implements a customizable grid overlay with adjustable size
- Supports snap-to-grid functionality for precise node positioning
- Grid size is adjustable from 20px to 100px via slider
- Visual grid can be toggled on/off independently of snapping behavior
// Update grid when size changes
function updateGrid() {
    // Clear existing grid
    svg.select('.grid').selectAll('*').remove();
    const gridGroup = svg.select('.grid');

    // Calculate number of lines
    const numHorizontalLines = Math.floor(height / gridSize);
    const numVerticalLines = Math.floor(width / gridSize);

    // Draw grid lines
    for (let i = 0; i <= numHorizontalLines; i++) {
        gridGroup.append('line')
            .attr('class', 'grid-line')
            .attr('x1', 0)
            .attr('y1', i * gridSize)
            .attr('x2', width)
            .attr('y2', i * gridSize)
            .style('display', showGrid ? 'block' : 'none');
    }

    // Similar for vertical lines...
}- Efficient DOM Updates: Uses D3's enter/update/exit pattern
- Event Delegation: Minimizes event listener overhead
- Simulation Optimization: Configurable alpha decay for faster settling
- Selective Redrawing: Only updates changed elements during interactions
- Position Caching: Preserves manual node positions during topology updates
The application maintains global state for:
- Current topology data and graph structure
- Selected layout type and detection information
- UI settings (labels, grid, snap-to-grid)
- Node positions and force simulation parameters
- Selection state (selected node/link)
- Network configuration (assignment strategy, auto ARP, queue length)
index.html- Main HTML file with embedded CSS and JavaScriptexamples/- Sample topology files
Contributions are welcome! Please feel free to submit a Pull Request.
- Fork the repository
- Create your feature branch (
git checkout -b feature/amazing-feature) - Commit your changes (
git commit -m 'Add some amazing feature') - Push to the branch (
git push origin feature/amazing-feature) - Open a Pull Request
This project is licensed under the MIT License - see the LICENSE file for details.
- Built with D3.js for visualization
- Inspired by the need for better network topology visualization tools for CS145 projects.