This project maps the forcible and non-forcible stops conducted by the DC Metropolitan Police Department (MPD) from 2010 to 2017. While this data was collected and released by the MPD, the MPD is currently non-compliant with the stop and frisk data reporting requirements mandated by the Neighborhood Engagement Achieves Results (NEAR) Act of 2016.
View the map here.
Read an analysis here.
| File | Description |
|---|---|
| images | Contains example images |
| original_data | Contains raw data retrieved from the DC Open Data Portal |
| transformed_data | Contains geolocated stop and frisk data (in geojson and csv format) and geographic regions with appended stop and frisk demographics (in geojson format) |
| README.md | This file |
| collection.js | Script for collecting properties from incidents that occurred in geographic regions |
| index.html | Interactive map of MPD stop and frisks |
| location_matching.py | Script for geolocating stop and frisk incidents based on the nearest block centroid |
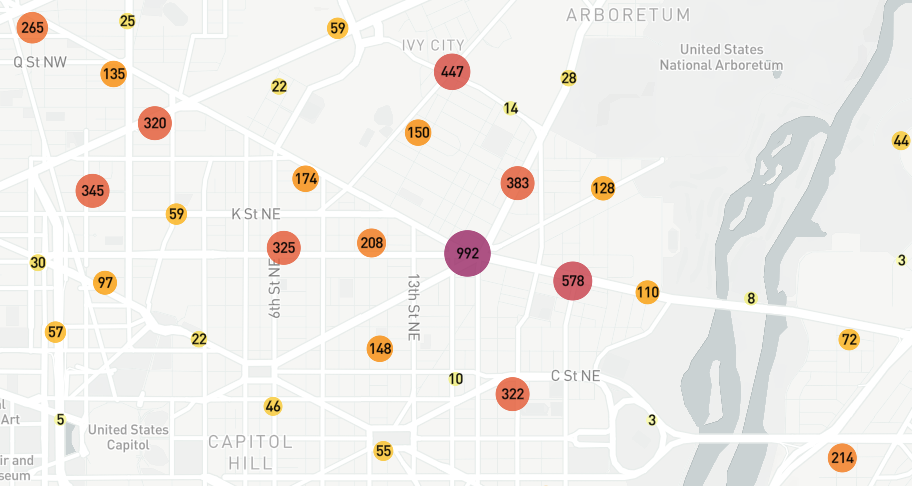
When utilizing the map, viewers should be aware that some geographic regions bisect stop and frisk hotspots and can distort patterns in police stops. For example, the individual incident layer clearly indicates that the area around Starburst Plaza saw an enormous number of police stops.
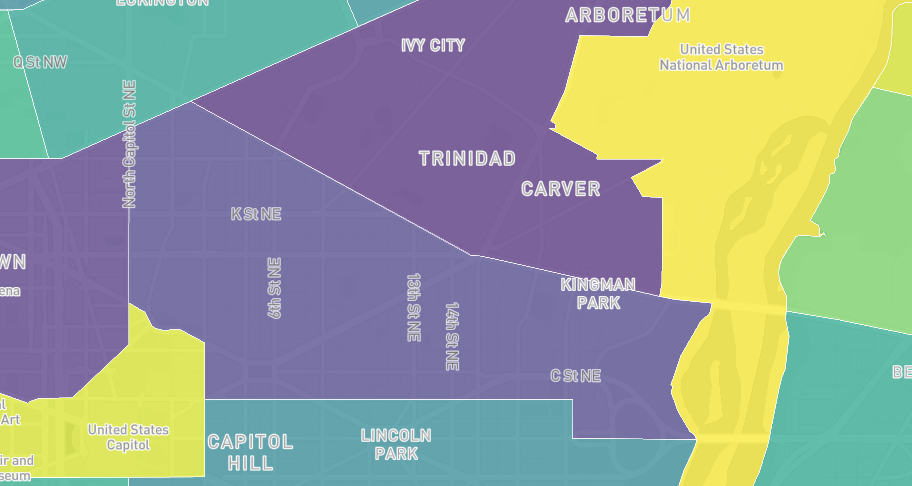
The neighborhood clusters centered around Starburst Plaza, those containing Trinidad and Kingman Park, present a similar story. They have among the highest stop and frisk incident counts of all DC neighborhoods.
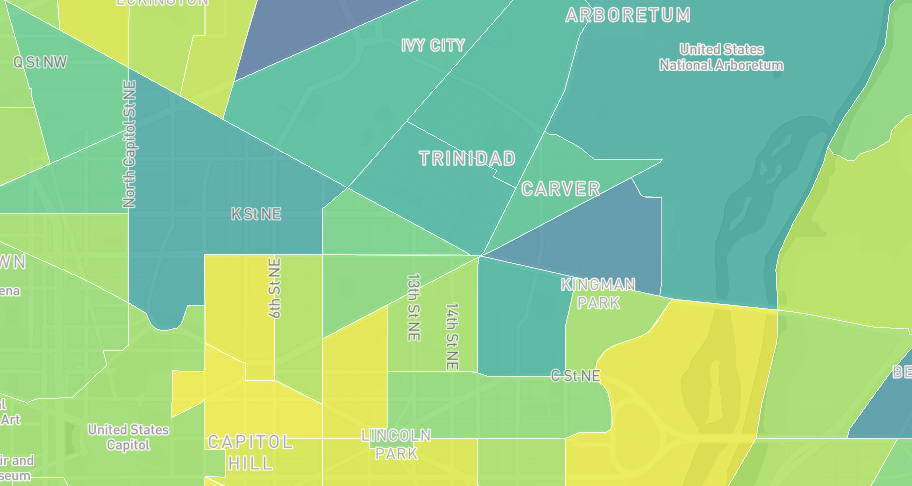
However, the smallest region, census tracts, does not suggest that this area had a particularly high number of stop and frisk incidents relative to the rest of the city. Each of the six streets intersecting at Sunburst Plaza (15th Street, Maryland Avenue, H Street, Florida Avenue, Bladensburg Avenue, and Benning Road) is a census tract boundary. As a result, the overall high number of incidents in this area is divided between seven census tracts, masking what was visible in the individual incident and neighborhood layers.
The MPD generally reports locations of stop and frisk incidents as a block (e.g. 4200 BLOCK OF 7TH STREET SE) or a corner (e.g. '46TH STREET NE / CENTRAL AVENUE NE'). The MPD did not validate these inputs, so there is significant variance in the way that the street is recorded (e.g. North Capitol Street might be recorded as 'N CAP', 'NORTH CAPITAL STREET NW', or 'N CAPITOL ST'). This project utilized several iterative regular expression replacements to fix these inconsistencies.
This project utilized DC Open Data's block centroid dataset to geocode incidents for consistency with other municipal data products. The block centroid dataset contains coordinates for every block in the city, the block's street and street number range, and the streets bookending the block. Cleaned stop and frisk incident locations were divided into either block or corner patterns. Block patterns were matched to the block street and fuzzy matched to the block street number endpoints. For corner patterns, one street of the corner was matched to the block street and the other street was matched to the bookending street. The first centroid matching this criteria in the dataset was used. There are a few ambiguous corners in DC. Florida Avenue intersects each of the lettered streets north of R Street twice in the Northwest quadrant, and Rhode Island Avenue and Brentwood Road intersect twice in the Northeast quadrant. These ambiguities account for around a dozen of the nearly 39,000 incidents and were again matched to the first corner in the dataset.
Finally, the city's block dataset (retrieved March 21, 2018) appears to omit the 400 Block of 2nd Street NW. Incidents on this block were hardcoded to (38.895455, -77.013668).
Overall, ~96% of forcible and ~82% of non-forcible incidents provided by MPD were successfully matched to a latitude and longitude. The remaining addresses were either missing, incorrect, or not specific enough to be matched.
The type and kind of map layers implemented in Mapbox GL JS has outstripped the implementation of filter expressions. As a result, the cluster and choropleth layers modify the mapbox source object and asynchronously re-render the map layer when a filter is updated. For the cluster layer, this is a relatively straightforward and only requires applying a function to the source data that returns true for filtered incidents. Implementing this filtering for choropleth layers was more involved, and an explanation could not be found elsewhere online. As a result, one solution is discussed here.
The collect module from Turf.js was used to collect features from the incidents that occurred in each polygon into arrays. An array was created for every region and dimension that filters operate along such that, within region, indexes of each dimension array correspond to the same incident. Specifically, the collect function was applied to every permutation of filterField[n] and polygonGeojson:
var collectedGeojson = turf.collect(polygonGeojson, incidentGeojson, filterField[0], filterField[0])When the user updates a filter, a set is created for each region containing all indexes of incidents that fulfill the filter's requirements. When applying multiple data filters, the cardinality of the intersection of these sets is the number of filtered incidents in each region. Blindman67 provided an efficient method for taking the intersect of n-sets that was adapted for use here:
function intersect(sets) {
  let minSize = sets[0].size;
  let shortSetIndex = 0;
  for (let i = 1; i < sets.length; i++) {
    if (sets[i].size < minSize) {
      minSize = sets[i].size;
      shortSetIndex = i;
    }
  }
  let shortSet = sets.splice(shortSetIndex, 1);
  let count = sets.length;
  let result = new Set(shortSet[0]);
  shortSet[0].forEach(item => {
    let i = count;
    let allHave = true;
    while (i--){
      allHave = sets[i].has(item);
      if (!allHave) { break }
    }
    if (!allHave) {
      result.delete(item);
    }
  })
  return result;
}
Once the number of filtered incidents has been computed, adding it to the map layer's geojson source enables use with Mapbox expressions. Here, the fill-color paint property is styled according to the filtered incident count. This process scales well with the number of filters, as the time neccesary to intersect subsequent sets decreases monotonically. If the number of data points or choropleth layers must be scaled, keeping track of feature properties in the data point geojson, rather than the polygon layer geojsons, is recommended.


