Insights into how super users of Microsoft Copilot emerge—and learn how to scale their success across your organization.
Download Latest (ZIP)
Archived Templates
Super Usage Interpretation Guide
Super Usage Storyboard PPT Template
- Static thresholds for usage tiers (clearer benchmarking)
- One click zoom into superusers
- Cross-team comparisons
- Direct Query template using Viva Insights connector (enables near-automatic weekly updates)
- NEW v30+: Scatterplots for additional cross-team analysis and deeper insights
Super usage patterns show how experimentation turns into durable habits. Identifying early signals and contextual attributes helps you:
- Replicate adoption paths
- Prioritize enablement
- Benchmark across teams
- Inspire the organization
Super usage profile:
What does super usage look like? What do super users use Copilot for? Are you seeing signs of workflow changes?
Journey:
How did some users turn into super users? What did super users do differently in the early days of license activation? How fast are you producing super users? Is super usage durable?
Work patterns:
What work patterns are associated with super users? Are you seeing any early impact?
Change management:
Where are the super users concentrated? Where might you focus enablement efforts?
⚠️ Disclaimer
This is an experimental template. On occasion, you may notice small deviations from metrics in the Copilot Dashboard. We will continue to iterate based on your feedback. Currently available in English only.
-
Open: https://analysis.insights.viva.office.com/Analysis/CreateAnalysis
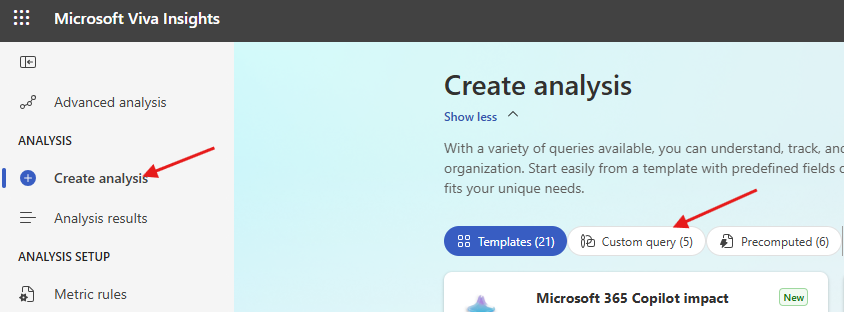
-
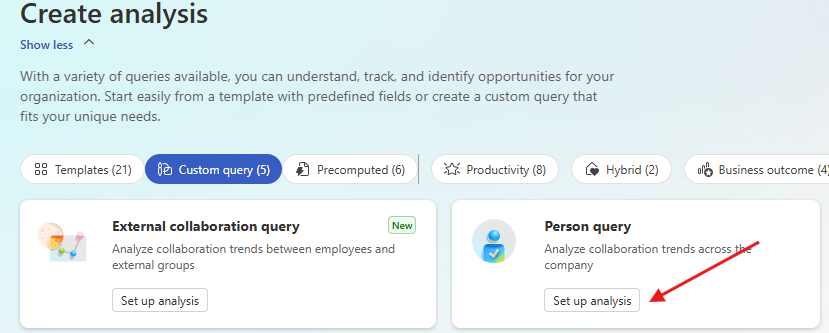
Select Person Query → Set up analysis.
-
Configure:
- Time period: Last 6 months (rolling)
- Group by: Week
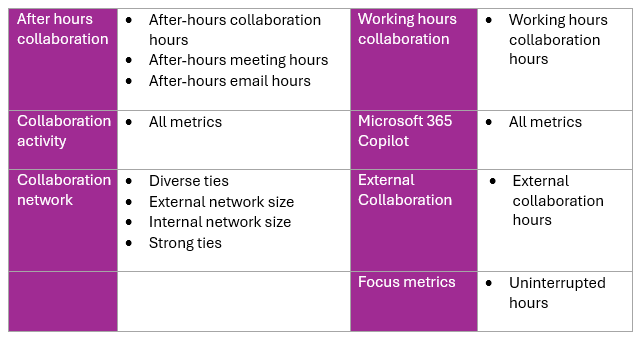
- Metrics: See sub-step 4 for required attribute selection.
- Filter: Is Active = True (if available) - You can validate the number of employees here.
- Attributes: Include Organization and Function Type (others optional) - this is the last box on this page.
-
Select ALL required metrics (missing one will cause blank visuals).
-
Save & Run query. Wait until Status = Completed (first runs can take several hours). Do not export mid-processing.
Import a CSV File
- Export results as CSV → Save clearly (e.g.,
SuperUsagePersonQuery_YYYY-MM-DD.csv). - Open
Template Super Usage Analysis (CSV).pbit→ point to CSV file path. - Save working PBIX and publish to Power BI service for sharing (manual refresh required for updates).
Setup Direct Query to Viva Insights
- From Person Queries page, copy link (row/link icon).
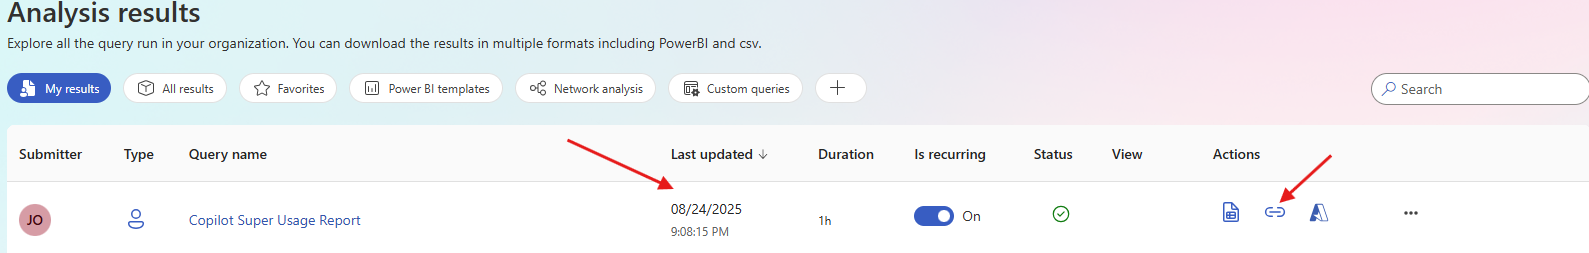
- Extract partitionId and queryId from URL. Confirm 36 characters each.
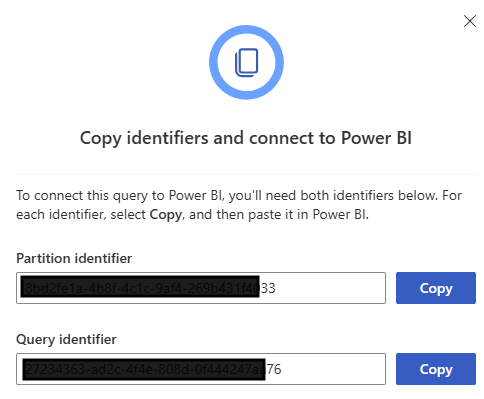
- Open
Template Super Usage Analysis (Direct Query).pbit→ paste IDs when prompted. - Sign in with your work account. Initial load may take 1–3 minutes.
- Save PBIX and publish to Power BI workspace. No scheduled refresh required (Direct Query auto-refreshes weekly).
Validation & Troubleshooting
Checklist for success:
- No errors on load
- Fields pane includes expected tables
- Executive Summary visuals populate (not all blank)
Common Mistakes & Fixes
| Symptom | Cause | Fix |
|---|---|---|
| Blank visuals | Missing required metric(s) | Re-export/re-run query with full set |
| Missing slicers/labels | Skipped Org/Function Type | Add both attributes and reprocess |
| Trend calcs broken | Grouped by Month | Use Week grouping |
| Partial weeks | Exported mid-processing | Wait until Status = Completed |
| Distorted adoption rates | Didn’t filter active users | Add Is Active = True |
| Load error | CSV open in Excel (Option 1) | Close file and retry |
| Direct Query blank | Wrong GUIDs or status not complete | Re-check IDs and query status |
Publish / Distribute
- Save your PBIX file after setup.
- If using Direct Query, publish to a Power BI workspace and configure credentials (OAuth2).
- If using CSV Import, publish the PBIX file but note that refreshes are manual.
Interpretation & Storytelling
Leverage the guides below to frame your narrative and drive action:
- Super Usage Interpretation Guide (PDF): Super Usage Interpretation Guide
- Storyboard presentation template: Super Usage Storyboard PPT Template
Use the included guides to:
- Create an executive-ready presentation
- Define what constitutes super usage internally
- Highlight early activation behaviors
- Recommend enablement actions per org or cohort
Monitor with Automatic Refresh
- Configure Published Report Refresh settings
- Navigate to Power BI Web (you may need to login)
- Find the Report and Semantic Model you just published.
- Hover over the Semantic Model and click on the icon as seen below:
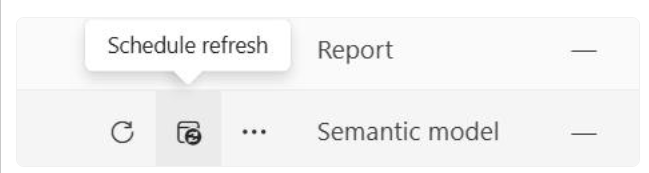
- On this page, from the list of options available, click on Refresh and then configure your report as seen below in the screenshot, or as you best fits your needs.
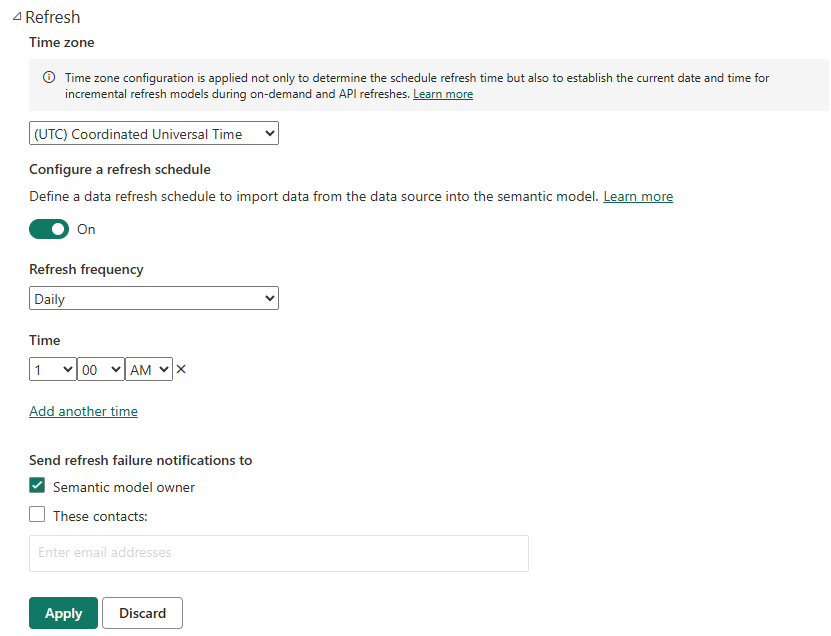
- For Direct Query: Reports update automatically with each weekly Viva Insights refresh, but you will still need to update the published report refresh settings as seen above.
- For CSV Import: Re-run your query, export a new CSV, and repoint the PBIX to the updated file.
- Verify weekly that a new week of data appears.
- Track emerging super users and adoption trends regularly.
We want to hear your feedback and suggestions. Please reach out to shahegde@microsoft.com or jordanking@microsoft.com.