-
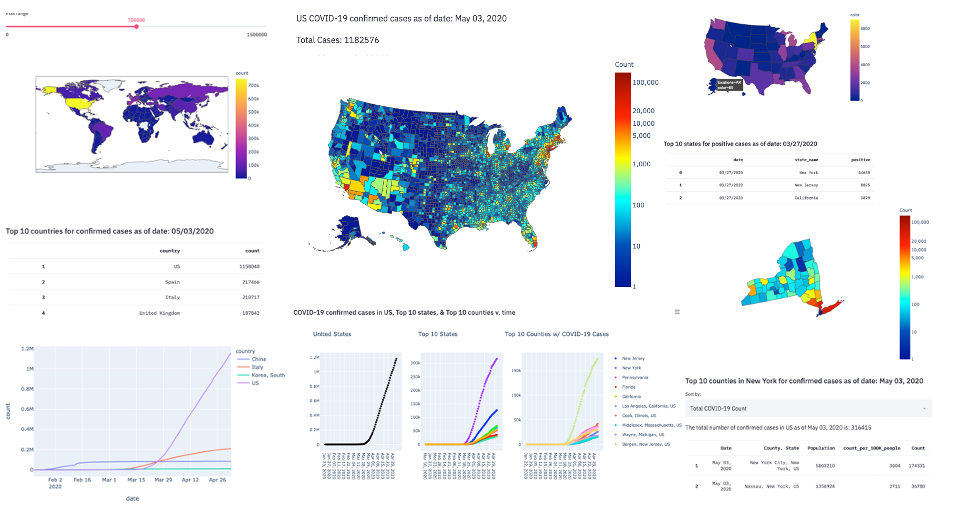
This is a COVID-19 tracking project using data compiled from Johns Hopkins (found here: https://github.com/CSSEGISandData/COVID-19/tree/master/csse_covid_19_data) and "The Covid Tracking Project" (https://covidtracking.com). You can explore confirmed cases, recovered cases, and mortality data of COVID-19 globally ('COVID19_app.py'), in individual US states ('States_COVID.py'), and in US counties ('County_COVID19_Data_Explorer.py').
-
Additional files include Jupyter Notebooks with 1) a brief comparison of actions taken in US and South Korea ('International_Gov_COVID19_Measures.ipynb'), 2) a walkthrough of the state data (with an early projection of COVID-19 cases using Prophet; 'States_Walkthrough_with_Prophet_ML.ipynb'), 3) a walkthrough of the county data ('COVID19_County_Data_Exploration.ipynb'), and 4) a walkthrough of county mortality prediction using Random Forest and analysis ('RandomForest_COVID19_Mortality.ipynb')
-
All components were written in Python (with some SQL) and can be run in Streamlit: https://www.streamlit.io/
-
You can run a file in streamlit using the command 'streamlit run NAME_OF_FILE.py' from terminal
-
There is one streamlit file for each of the global, state, and county-level data: 'COVID19_app.py', 'States_COVID.py', and 'County_COVID19_Data_Explorer.py' respectively
-
The 'County_COVID19_Data_Explorer.py' file has dependency on the 'Functions_County_COVID19_Data_Explorer.py' file; both of these files can be found in the 'County_Files_COVID-19' folder. The global and state data files are present within the main project folder
-
Link to code for Global COVID-19 : https://github.com/mwaters166/COVID-19_Project/blob/master/COVID19_app.py
-
View video to see the walkthrough on streamlit: https://raw.githubusercontent.com/mwaters166/COVID-19_Project/master/streamlit-COVID19_app-2020-03-23-23-03-06.webm.mp4?token=AIWDJKL2C2DUY7R6Z4XKP5K6QK5RM
-
To run the project (after downloading project folder and installing streamlit), navigate to the project folder within terminal and use the command: streamlit run COVID19_app.py
-
Update (3/26/2020): JHU is currently updating their data set, so the second part of this project (containing the US state data) will be updated once the state data has been returned/redirected to a new repository. The code was written based on formatting of archived JHU data sets, which originally contained US state data. The archived data can be found at the following link: https://github.com/CSSEGISandData/COVID-19/tree/master/archived_data/archived_time_series. -MW
-
Update (3/27/2020): Updated project with US state data from "The Covid Tracking Project" api: https://covidtracking.com/api/ The state data has the previous functionality, allows users the option to choose between: 'Positive tests', 'Negative tests', 'Total tests','Daily Change in Positive Cases','Daily Change in Negative Cases','Daily Change in Total Tests','Pending Tests','Hospitalized','Deaths', and 'Daily Change in Deaths' data. It also adds a feature displaying the top 10 states for chosen COVID-19 parameter.-MW
-
Link to COVID-19 state code (3/27/2020): https://github.com/mwaters166/COVID-19_Project/blob/master/States_COVID.py
-
To run the project, in terminal use the command: streamlit run States_COVID.py
-
View video to see the walkthrough of US state data on streamlit (3/27/2020): https://raw.githubusercontent.com/mwaters166/COVID-19_Project/master/streamlit-States_COVID-2020-03-27_video_walkthrough.mp4
-
Added Jupyter Notebooks (4/3/2020):
-'States_Walkthrough_with_Prophet_ML'(https://github.com/mwaters166/COVID-19_Project/blob/master/States_Walkthrough_with_ProphetML.ipynb): explores the state data, then looks at using Prophet (https://facebook.github.io/prophet/) to forecast confirmed cases of COVID-19 in NY state. Data source: https://ourworldindata.org/covid-testing -MW
-'International_Gov_COVID19_Measures'(https://github.com/mwaters166/COVID-19_Project/blob/master/International_Gov_COVID19_Measures.ipynb): compares positive cases, testing, and government measures implemented to limit COVID-19 spread in the US and South Korea. Data source: https://www.acaps.org/covid19-government-measures-dataset -MW
-
Added Data Exploration of County Data within 'County_Files_COVID-19' folder (5/4/2020): https://github.com/mwaters166/COVID-19_Project/tree/master/County_Files_COVID-19
-
Link to COVID-19 county code (Updated: 5/4/2020): https://github.com/mwaters166/COVID-19_Project/blob/master/County_Files_COVID-19/County_COVID19_Data_Explorer.py . This file is meant to be run within the same folder as the corresponding function file: https://github.com/mwaters166/COVID-19_Project/blob/master/County_Files_COVID-19/Functions_County_COVID19_Data_Explorer.py
-
To run the project, in terminal use the command: streamlit run County_COVID19_Data_Explorer.py
-
Added Jupyter notebook with county data functions: https://github.com/mwaters166/COVID-19_Project/blob/master/County_Files_COVID-19/COVID19_County_Data_Exploration.ipynb
-
Added streamlit video walkthrough for 'County_COVID19_Data_Explorer.py': https://github.com/mwaters166/COVID-19_Project/blob/master/County_Files_COVID-19/streamlit-County_COVID19_Data_Explorer-2020-05-04-14-05-59.webm.mp4
-
Added Jupyter notebook with a Random Forest model for predicting county COVID-19 Mortality and subsequent analysis (Updated: 5/26/2020): https://github.com/mwaters166/COVID-19_Project/blob/master/County_Files_COVID-19/RandomForest_COVID19_Mortality.ipynb
-
Corresponding cleaned datasets used in 'RandomForest_COVID19_Mortality.ipynb' (Updated: 5/26/2020): https://github.com/mwaters166/COVID-19_Project/blob/master/County_Files_COVID-19/County_RF_csv_files.zip
-
Individual Jupyter Notebooks for data cleaning and merging files in Python & SQL: https://github.com/mwaters166/COVID-19_Project/tree/master/County_Files_COVID-19/Data_Cleaning_Jupyter_Notebooks
-
Original sources for raw data used in 'RandomForest_COVID19_Mortality.ipynb': 1) County health rankings: https://www.countyhealthrankings.org/explore-health-rankings/rankings-data-documentation , 2) Global mobility report: https://www.google.com/covid19/mobility/ , 3) ICU Capacity: https://khn.org/news/as-coronavirus-spreads-widely-millions-of-older-americans-live-in-counties-with-no-icu-beds/ , 4) County area: https://www.census.gov/library/publications/2011/compendia/usa-counties-2011.html , 5) Hard to count populations: https://www.censushardtocountmaps2020.us/ , 6) Kinsa fever data api: https://www.kinsahealth.co/enterprise/kinsa-insights/ , 7) JHU COVID-19 Mortality (linked above)
