TournamentResults2011
As part of the Introduction to Artificial Intelligence course offered online by Stanford University, the OpenNERO team at UTCS hosted an online machine learning tournament. Anyone was allowed to participate by submitting online a team of virtual agent controllers for the NERO Machine Learning Game module of OpenNERO. In each match, two teams of autonomous agents with individual sensor arrays, controllers and action outputs attempt to outsmart each other by firing virtual lasers which remove opponent agents from play. The only difference between the teams is in the training of the controllers contributed by the competitors.
 |
We accepted two types of controllers: artificial neural network controllers of arbitrary weight and topology, and hash tables approximating the behavior function. The NERO module of OpenNERO by default provides two methods of training these controller types, namely rtNEAT for the networks and a time-difference reinforcement learning method, Q-learning, for the tables. The competitors have the ability to extend and/or modify these training methods as well as create their own training environments and regimens. It is this training that determines how fit the team will be when pitted against other teams submitted to the tournament.
There were 156 teams submitted to the OpenNERO tournament. Of these, 150 contained neural networks and 11 contained RL controller tables (mixed teams were allowed). Each team could be made up from anywhere between 1 and 50 individual controllers, with any number of repeats. If the number of controllers in the team file was smaller than the number of agents fielded for the match (50), controllers were repeatedly cloned from the available controller list in a round-robin fashion.
Because of the large number of teams, each game is played off-screen and limited to 5 minutes of game time. The team with the highest number of remaining hit points is declared winner at the end of the 5-minute match. Ties are rare, and are broken by a pseudo-random coin toss. The match-making script allows matches to be run in parallel on a single machine or to be distributed to a Condor compute cluster.
We first ran several double-elimination tournaments with the teams submitted. The teams were initially assigned an opponent or given a bye at random, and then were allowed to compete in a single-elimination "winners' bracket" until their first loss. When this happened, the losing teams were moved into a secondary "losers' bracket", where they got a second chance until they lost a second game, at which point they were eliminated from the tournament. The overall winner was decided after a match between a winner in the primary bracket and a winner in the secondary bracket. If the primary bracket team won, it was declared the overall winner. If the primary bracket team lost, the match was repeated and the winner of the resulting match is declared winner.
A sample set of results from the double-elimination tournament can be seen here. After running such tournaments repeatedly, we noticed that while the set of teams in the top 10 was generally consistent, their ranking was not stable. Thus, we decided to run a more complete round robin tournament, where each team gets to play every other team, and the ranking is determined according to the number of wins.
In the Round Robin version of the tournament, each of the 156 submitted teams was matched against the 155 other teams, creating 24180 separate games. Each pair of teams was matched up twice, allowing each team to play as the blue team and as the red team. Each match was limited to 5 minutes of play. The rest of this page describes the results of this tournament in more detail.
The teams can be ranked according to the overall number of wins among the N-1 matches played. According to this metric, Peter Kishalov took 1st place, Miron Sorin and Kevin shared 2nd place, and Mario Tambos came in 3rd. Congratulations to the winners!
The complete listing is available for download as a tab-separated file: tourney-run-RR-wins.txt.
| Team Name | Number of matches won |
|---|---|
| synth.pop (Peter Kishalov) | 137 |
| synth-flag.pop (Peter Kishalov) | 130 |
| me - Rambo (Miron Sorin) | 126 |
| lolwutamidoing (Kevin) | 126 |
| PollusPirata (Mario Tambos) | 125 |
| Cyber-trout (Brian Murphy) | 124 |
| CirclingBullies (CirclingBullies) | 123 |
| SneakySnipers (SneakySnipers) | 121 |
| Tut (Tut) | 121 |
| coward1 (Caciula Maricel) | 120 |
Teams can also be ranked according to the average score difference acheived across all the matches played. According to this metric, Miron Sorin took 1st place, Peter Kishalov took 2nd, and Kevin came in 3rd. Congratulations!
| Team Name | Mean Score | Standard Deviation |
|---|---|---|
| me - Rambo (Miron Sorin) | 428.73 | 66.11 |
| synth.pop (Peter Kishalov) | 407.37 | 53.36 |
| lolwutamidoing (Kevin) | 385.83 | 68.26 |
| synth-flag.pop (Peter Kishalov) | 383.84 | 60.03 |
| Cyber-trout (Brian Murphy) | 376.19 | 69.59 |
| CirclingBullies (CirclingBullies) | 367.02 | 67.78 |
| coward1 (Caciula Maricel) | 349.67 | 74.90 |
| PollusPirata (Mario Tambos) | 312.96 | 62.46 |
| generado6 (Luis Deleon) | 300.88 | 60.87 |
| bettersnipers (Speedy Caterpillar) | 292.88 | 67.96 |
The complete listing is available for download as a tab-separated file: tourney-run-RR-scores.txt.
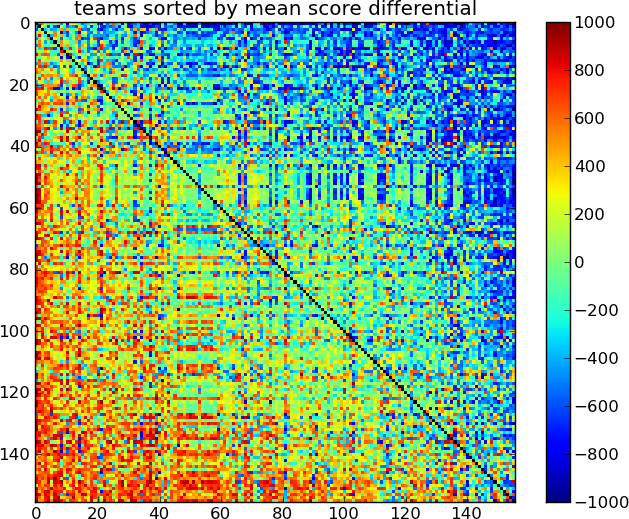
In this graph, the tournament results are summarized in a color matrix plot. Red colors indicate victory by a team along the Y-axis (teams are sorted in order of total score). Blue colors indicate victory by teams along the X-axis (same order as the Y-axis).
For each pair of teams, each team plays once as blue and once as red. The black line along the diagonal indicates that teams do not play matches against themselves.
Bands of similar pattern of victories and defeats indicate a number of similar teams submitted - because they are nearly identical, they get similar results and appear next to each other in the ranking.
The process is stochastic, so the exact score will change from game to game. This also explains why the upper and lower triangular parts of the matrix are not exact mirror images.


For each team, the average score advantage is shown along with the standard error across the matches played. The teams are sorted according to the score advantage.


For each team, the total number of wins is shown. The teams are sorted according to the total number of wins.
Individual match scores from the tournament are available for download as well: tourney-run-RR-raw.txt.gz. Each line of this file contains four tab-separated fields: the name of blue team, the name of red team, total damage sustained by red team (score of blue team), and total damage sustained by blue team (score of red team).
In order to get an idea of what happens in each battle, we have included several sample video recordings of individual matches. In all of the games you will see simulated lasers fire. GREEN lines indicate that the laser has hit a wall. BLUE means the laser was successfully fired by the blue team (team 1) and RED means it was successfully fired by the red team (team 2).
Video 1: synth.pop (Peter Kishalov) vs me - Rambo (Miron Sorin)

The two top-ranked teams by average score difference are pitted against each other in this match. Their strategies appear similar at first glance - the teams both hug the wall closely and follow each other lock step. However, small differences in speed make this jousting match heavily favor the red team, which is able to take shots at the blue team as it comes around the corner.
Video 2: EvilCowards (Evil Cowards) vs. me - Rambo (Miron Sorin)

The higher-ranked "me - Rambo" loses to a team that only has 106 victories. The strategies here are quite different - instead of sticking to the wall, the Evil Cowards team chooses to spread out and stay away, taking shots from afar.
Video 3: EvilCowards vs. synth.pop (Peter Kishalov)

While the higher-ranked "me - Rambo", loses to the team EvilCowards, "synth.pop" does not. The strategy it uses to defeat EvilCowards is also quite interesting - the team splits up into two, and effectively outflanks the opponent team while distracting it. This means that there is no transitive property in this space - just because team A beats team B and team B beats team C, does not mean that team A will beat team C.
After each team plays every possible opponent, the number of wins accrued by each team (Table 1) provides a reasonable estimate of the probability of that team winning in a future match. Despite the large number of teams, no single competitor emerged that signicantly outperformed all others.
In fact, Figure 3 shows the distribution of wins over all teams in the round-robin tournament. This distribution is approximately normal with mean 76.7 and standard deviation 28.0; the fact that the distribution is normal implies that teams (or, more precisely, the number of wins that each team accrues) can be thought of as repeated samples from a common underlying process. Whether this distribution reflects the battle task in a general sense, or simply the pool of teams itself, remains a topic for future exploration.
Figure 2 shows the mean and standard deviation of score differentials for all teams in the roundrobin tournament. The teams as a group tended to cluster around a mean score differential of zero, with some teams performing significantly better than the mean, others performing significantly worse than the mean, and most teams performing near zero. In fact, the empirical distribution of score differentials is basically a zerocentered normal with standard deviation around 190. Teams in the top ten by average match score (see Table 2) were at least 1.5 standard deviations above the mean, and the top team exceeded the mean by 2.2 standard deviations. Here again, the fact that the score distribution looks normal for our population of teams implies that these values are coming from a common underlying process. Combined with the conclusion above about the distribution of wins, we hypothesize that we can model team-formation using a common underlying distribution.
As noted previously, double-elimination tournaments can be seen as a sort of mitigation of the impact of upsets in a single-elimination tournament. However, we found that for the NERO battle task, even a double-elimination tournament structure did not effectively mitigate upsets, resulting in a relatively unstable winner for repeated tournaments.
Several of the best teams in the tournament independently adopted similar strategies for winning. Because NERO agent behavior can be "shaped" by progressively changing the reward structure in the task during training, teams of agents can be created that perform specific tasks during a battle.
The most prominent strategy among winning teams was to train agents to move as a group around the central wall. This strategy shows up in several of the top 10 teams, but most notably in synth.pop and me - Rambo. These teams actively pursued their opponents by forming agents into a "train" that ran around the wall and, by grouping together, was usually able to eliminate opponents effectively.
A second strategy was adopted by several teams but ended up somewhat less successful in the round-robin tournament. In this strategy, most agents backpedaled away from the opponents and the central wall. Backpedaling preserves the ability of the agents to fire at opponents, while increasing the distance to the opposing team. Backing up was sometimes effective against the "train" strategy because a team could eliminate the train of opponents as they appeared around the edge of the wall. Examples of this strategy included EvilCowards and SneakySnipers.
Some teams followed an intermediate strategy, where all agents on the team would run to the right or left of the wall, mostly as a group. Interestingly, this strategy seemed to perform the least well in our tournament. Against the teams that adopted a "train" strategy, agents following the "run in the middle" strategy were often not pointed toward their opponents, and thus could be fired upon without recourse. Similarly, teams following the "middle" strategy tended to fail against "backpedaling" teams because the "middle" agents again tended to not be pointed toward enemy agents often enough to fire successfully. One team that adopted the "middle" strategy was okarma_warriors, which earned just 15 wins in the round-robin tournament.
Perhaps most interestingly, we identified at least one cycle of winning strategies among the top teams in the tournament. The third-place me - Rambo (a "train" team) tends to defeat the firstplace synth.pop (also a "train" team), mostly due to subtle differences in timing. synth.pop tends to win versus 24th-place EvilCowards (a "backpedaling" team), because the synth.pop train splits into two and breaches the wall from both edges simultaneously. However, EvilCowards frequently defeats me - Rambo in the battle task, because agents in the me - Rambo train are eliminated one-at-a-time as they come around the wall!
This is just one example, but there are other cycles in the tournament graph as well. The implication is that there is not a team in the tournament that is objectively better than all other teams; instead, the task is such that strategies must be able to adapt to their individual opponents.
As we get permission from participants to make their teams available for download, we will commit the gzipped files to this folder: misc/tourney/teams.
Because OpenNERO will likely change, these teams will perform differently in future versions. Thus, when replaying matches between these teams, be sure to use the version of OpenNERO that was used during the tournament. This version can be built from source by checking out the subversion tag tags/tourney2011 or by downloading the specific binary distributions equivalent to this tag:
- OpenNERO for Mac OS X (i386)
- OpenNERO for 32-bit Ubuntu Linux 10.4 (i686)
- OpenNERO for 64-bit Ubuntu Linux 10.4 (x86_64)
- OpenNERO for 32-bit Microsoft Windows (win32)
- OpenNERO for 64-bit Microsoft Windows (win64)
A collection of scripts for running the tournament is maintained in the repository under misc/tourney. In order to run the tournament on a Linux machine, copy the scripts from this directory to the directory with the OpenNERO executable. Use the --help command-line argument to find out more about how to run these scripts.
- battle_tournament.py - use this script to run a double-elimination or a round-robin tournament over a collection of teams. The script supports parallelization over machine cores or over a Condor cluster system.
- condor_battle.sh - this script is used to run a single time-limited match between two teams. It accepts four parameters: the two team files, a time limit (in seconds), and a log file to record the match to.
- tourney_viz_de.py - use the output of battle_tournament.py in double-elimination mode to generate a detailed HTML page and GraphViz based visualizations of tournament results.
- tourney_viz_rr.py - use the output of battle_tournament.py in round-robin mode to generate a set of matrix plots and other information (which is included in this page).
You can run your own tournament between collections of teams by using the same scripts we used to run these tournaments on our servers. The scripts are available for checkout along with the source code. Again, please be aware that future versions may be incompatible with the current tournament format. If you encounter compatibility problems, please use the tourney2011 subversion tag.
- Download and build a copy of OpenNERO.
- Copy tournament scripts into the OpenNERO binary directory.
- Run the battle_tournament.py script to run the tournament.
* Use the --help parameter to learn about the command line options available.
* Use the -r option to specify the number of times to repeat each game in the round-robin tournament.
* Use the -n option to specify the number processes to use (normally the same or less than the number of cores or processing nodes available).
* Use the -c option to run on Condor instead of the local machine.
* Specify all the teams participating in the tournament on the command line (use the
*and?wild-cards as needed). * Save the output of the script for future reference using the > output redirect syntax.
The tournament and visualization scrips were written by Leif Johnson and Igor V. Karpov. An early version of the tournament was run in the undergraduate Artificial Intelligence course and the graduate Artificial Neural Networks course taught by Risto Miikkulainen at UT Austin Computer Science.