
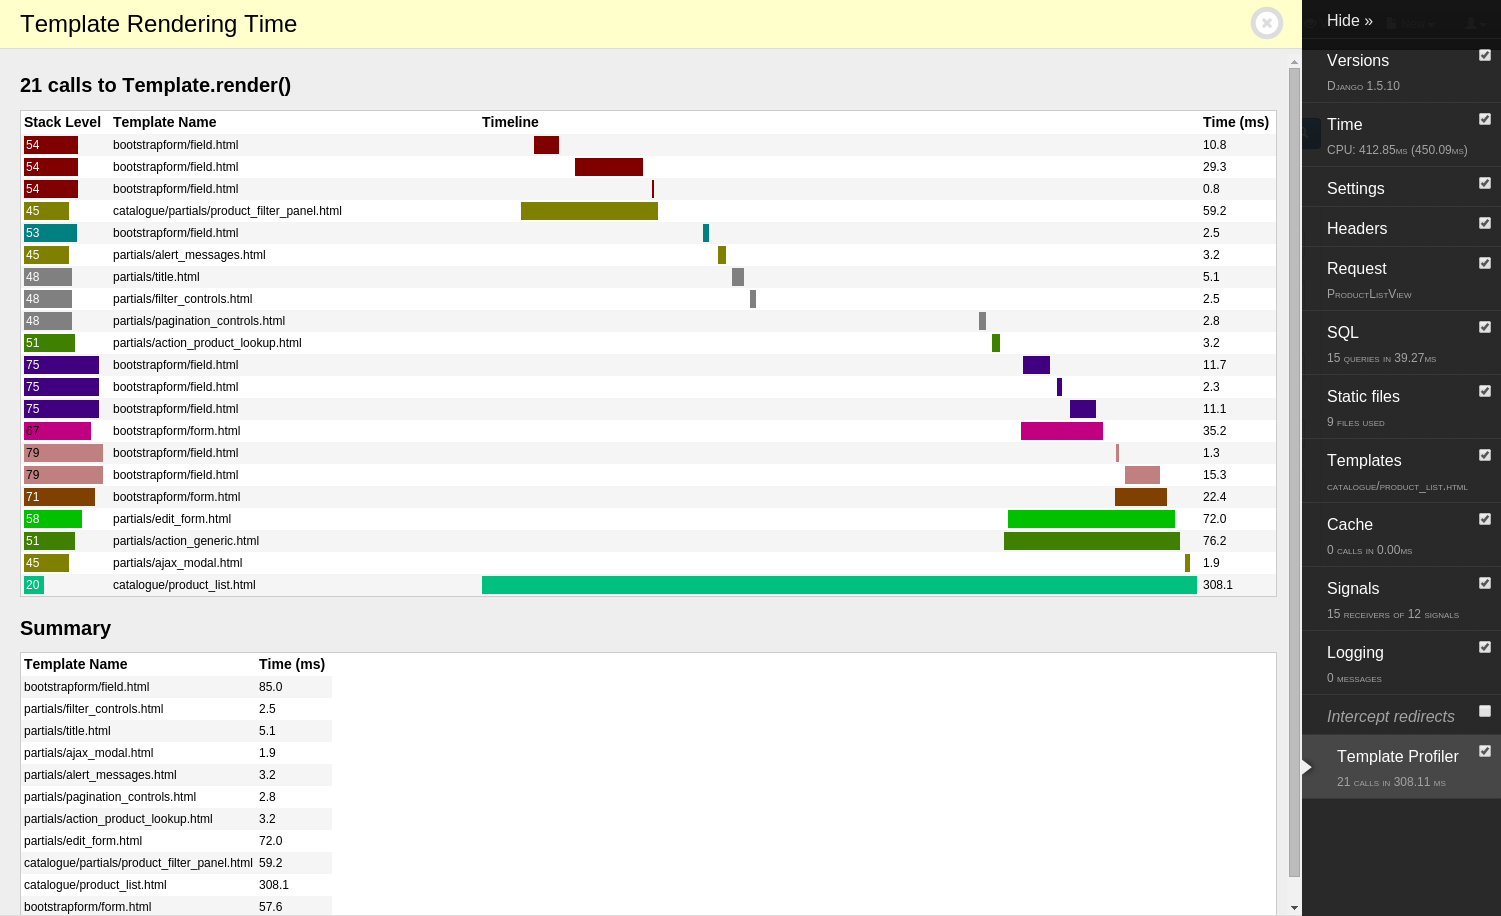
An extra panel for django-debug-toolbar that displays time spent rendering each template.
For example:
First, you'll need to install and configure django-debug-toolbar as per its installation instructions.
Second, install this package:
pip install django-debug-toolbar-template-profilerThird, add it to your installed apps - order doesn't matter but after debug_toolbar will keep it neatly grouped:
INSTALLED_APPS = [
    # ...
    "debug_toolbar",
    "template_profiler_panel",
    # ...
]
Fourth, configure django-debug-toolbar's DEBUG_TOOLBAR_PANELS setting
as per its documentation
to include the panel. You'll need to copy the default and add the panel at the
end:
DEBUG_TOOLBAR_PANELS = [
    # ...
    "template_profiler_panel.panels.template.TemplateProfilerPanel",
]
After this, you should see the "Template Profiler" panel when you load the
toolbar. Both Django and Jinja2 template render() calls will be measured.